Python, arcpy, ArcGIS SDK
Automation
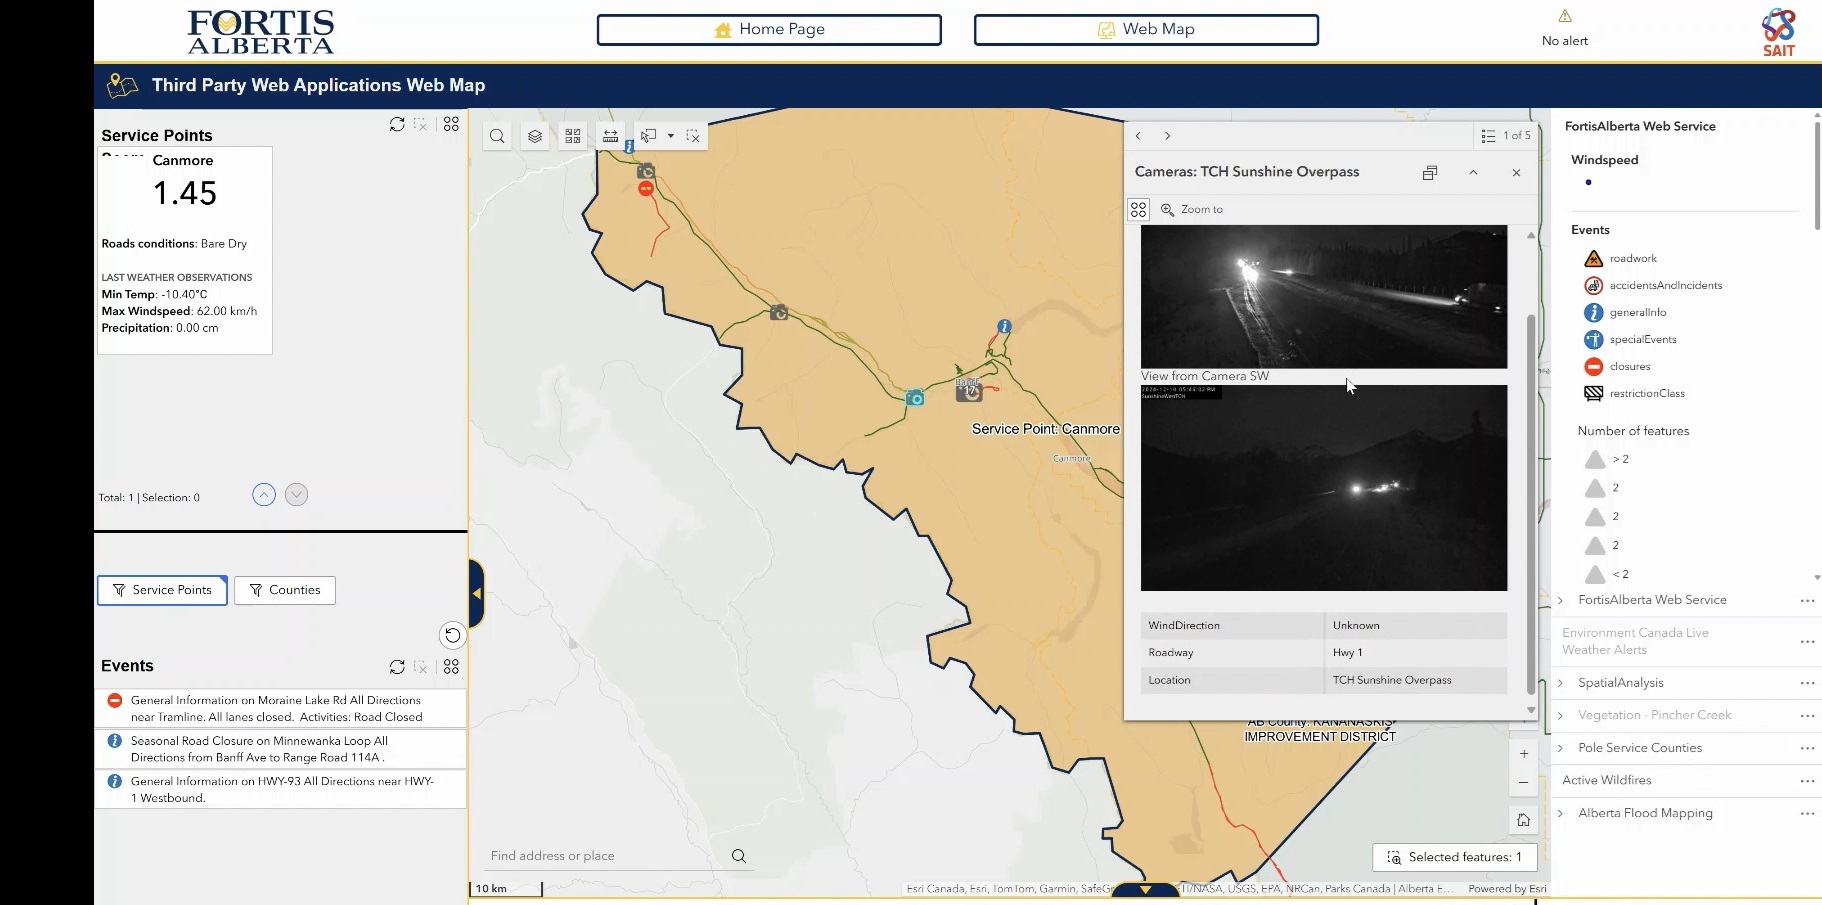
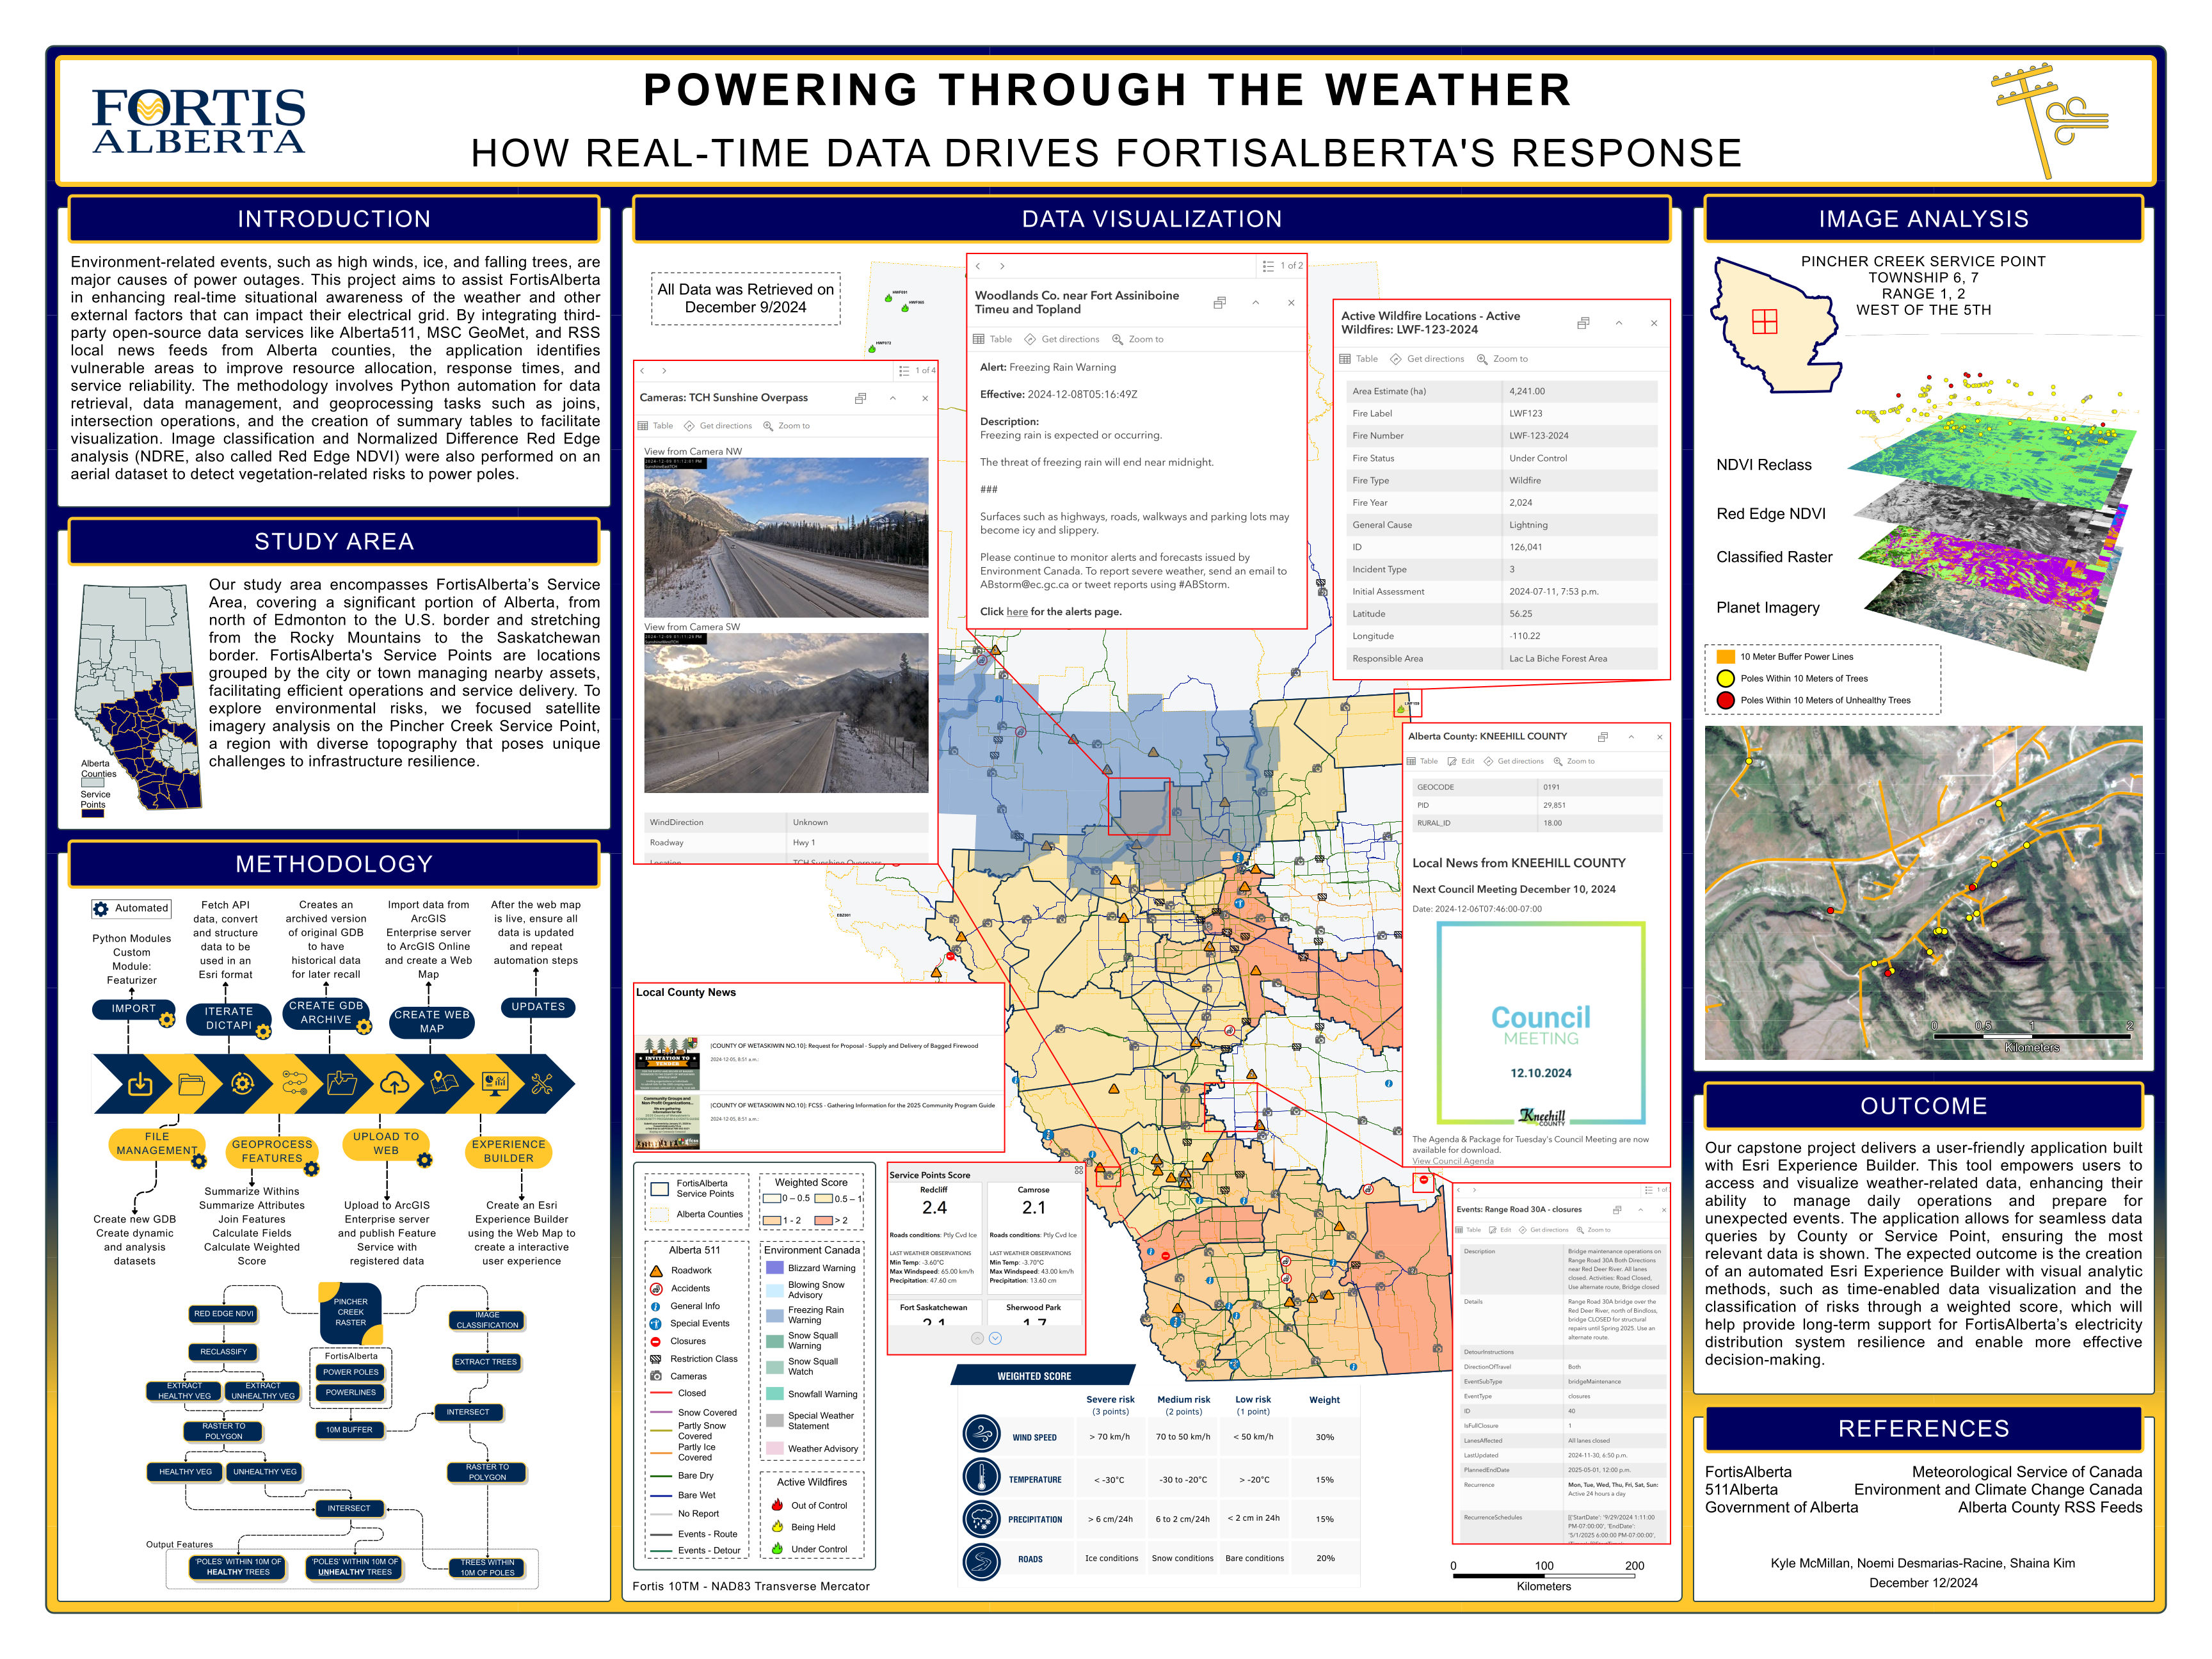
For our final GIS Capstone project in partnership with FortisAlberta, we had the opportunity to push limits of our knowledge in the ArcGIS Python libraries to deliver real-time geoprocessed road conditions and weather-related data in a Web Mapping Application.
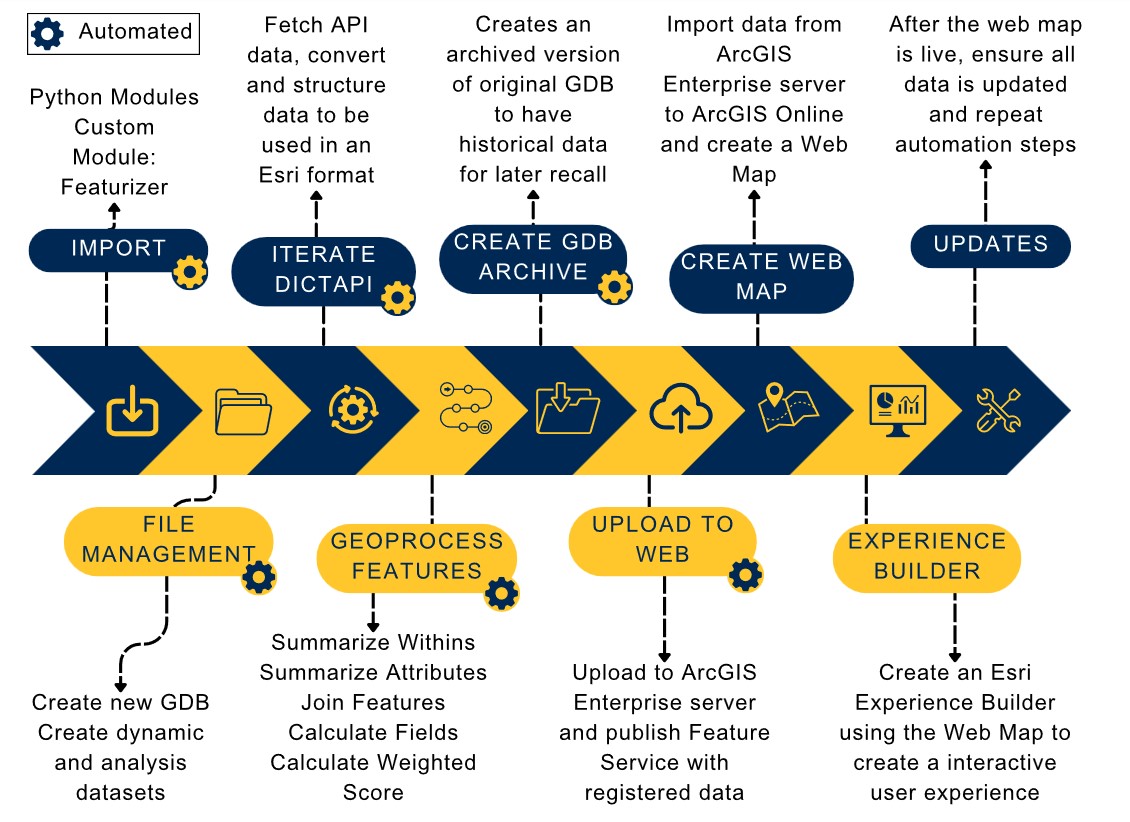
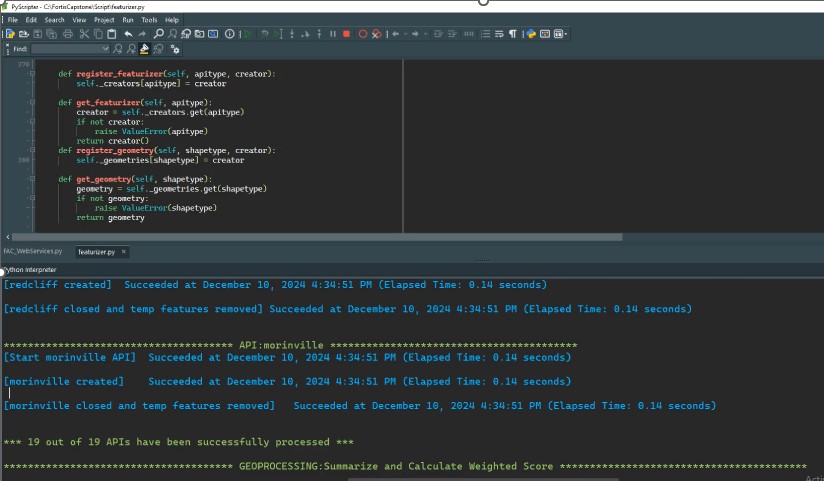
- REST API The raw data came from a variety of GeoJSON, non standard JSON APIs and RSS feeds. Our script automated all imports into Python Dictionaries on demand.
- Create geometries All feeds were translated into geometries and/or attribute tables and saved into an ArcGIS Pro geodatabase.
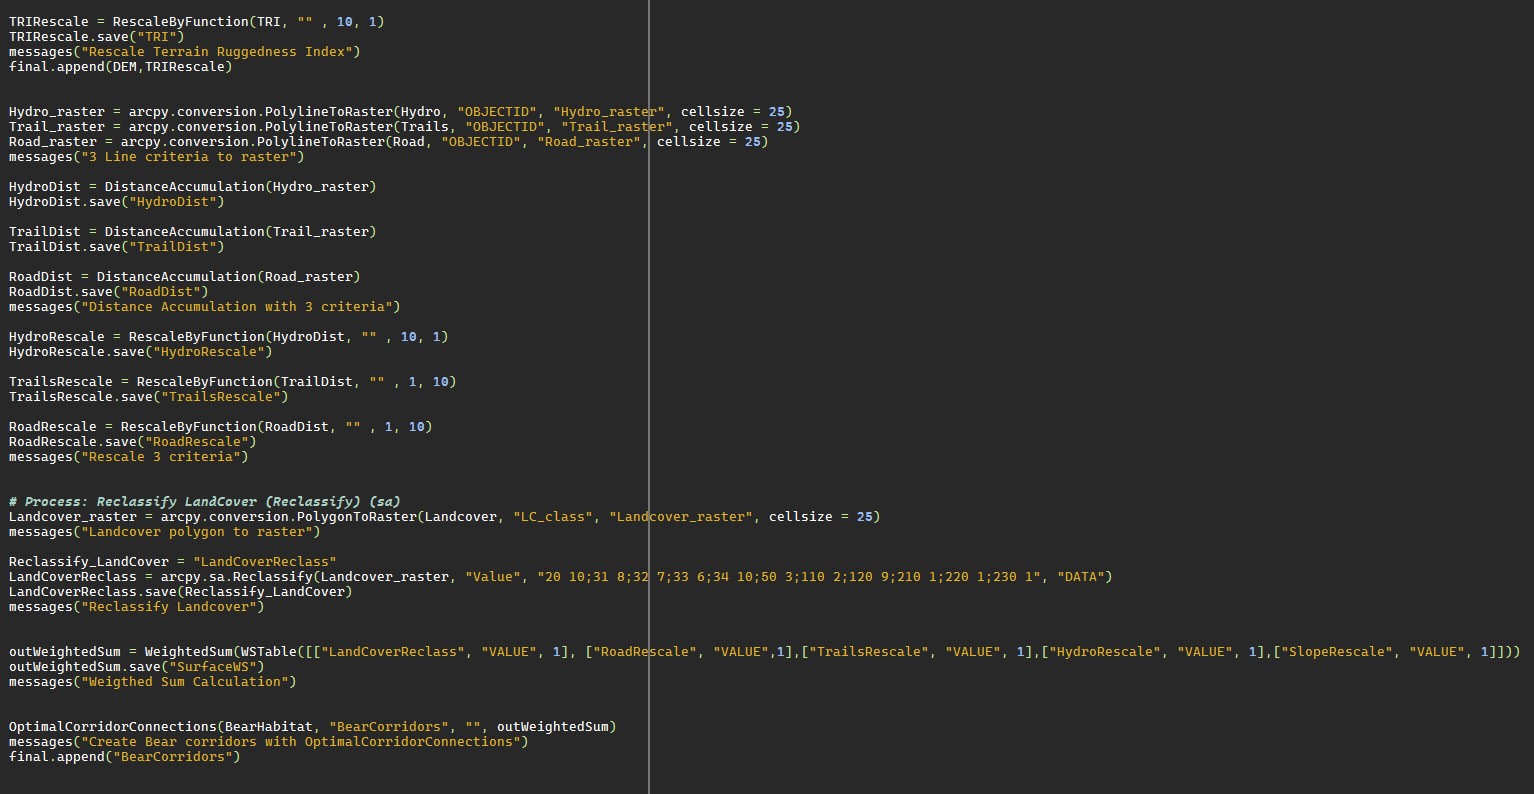
- Geoprocessing Operations on the raw data were included in the script to ensure the proper integration of data online. Performing data and attributes manipulation on the local machine before uploading the datasets online reduced the utilization of cloud and network resources for the geoprocessing.
My teamates in the Fall 2024 Capstone project with FortisAlberta were Shaina Kim and Kyle McMillan.
ArcGIS Pro, Illustrator, Figma
Visualization
I have had graphic design training for a some years and studied cartography in a previous geography major. Illustrator and Figma are great icon creators and front-end development tools that complements ArcGIS Pro's cartographic capabilities.
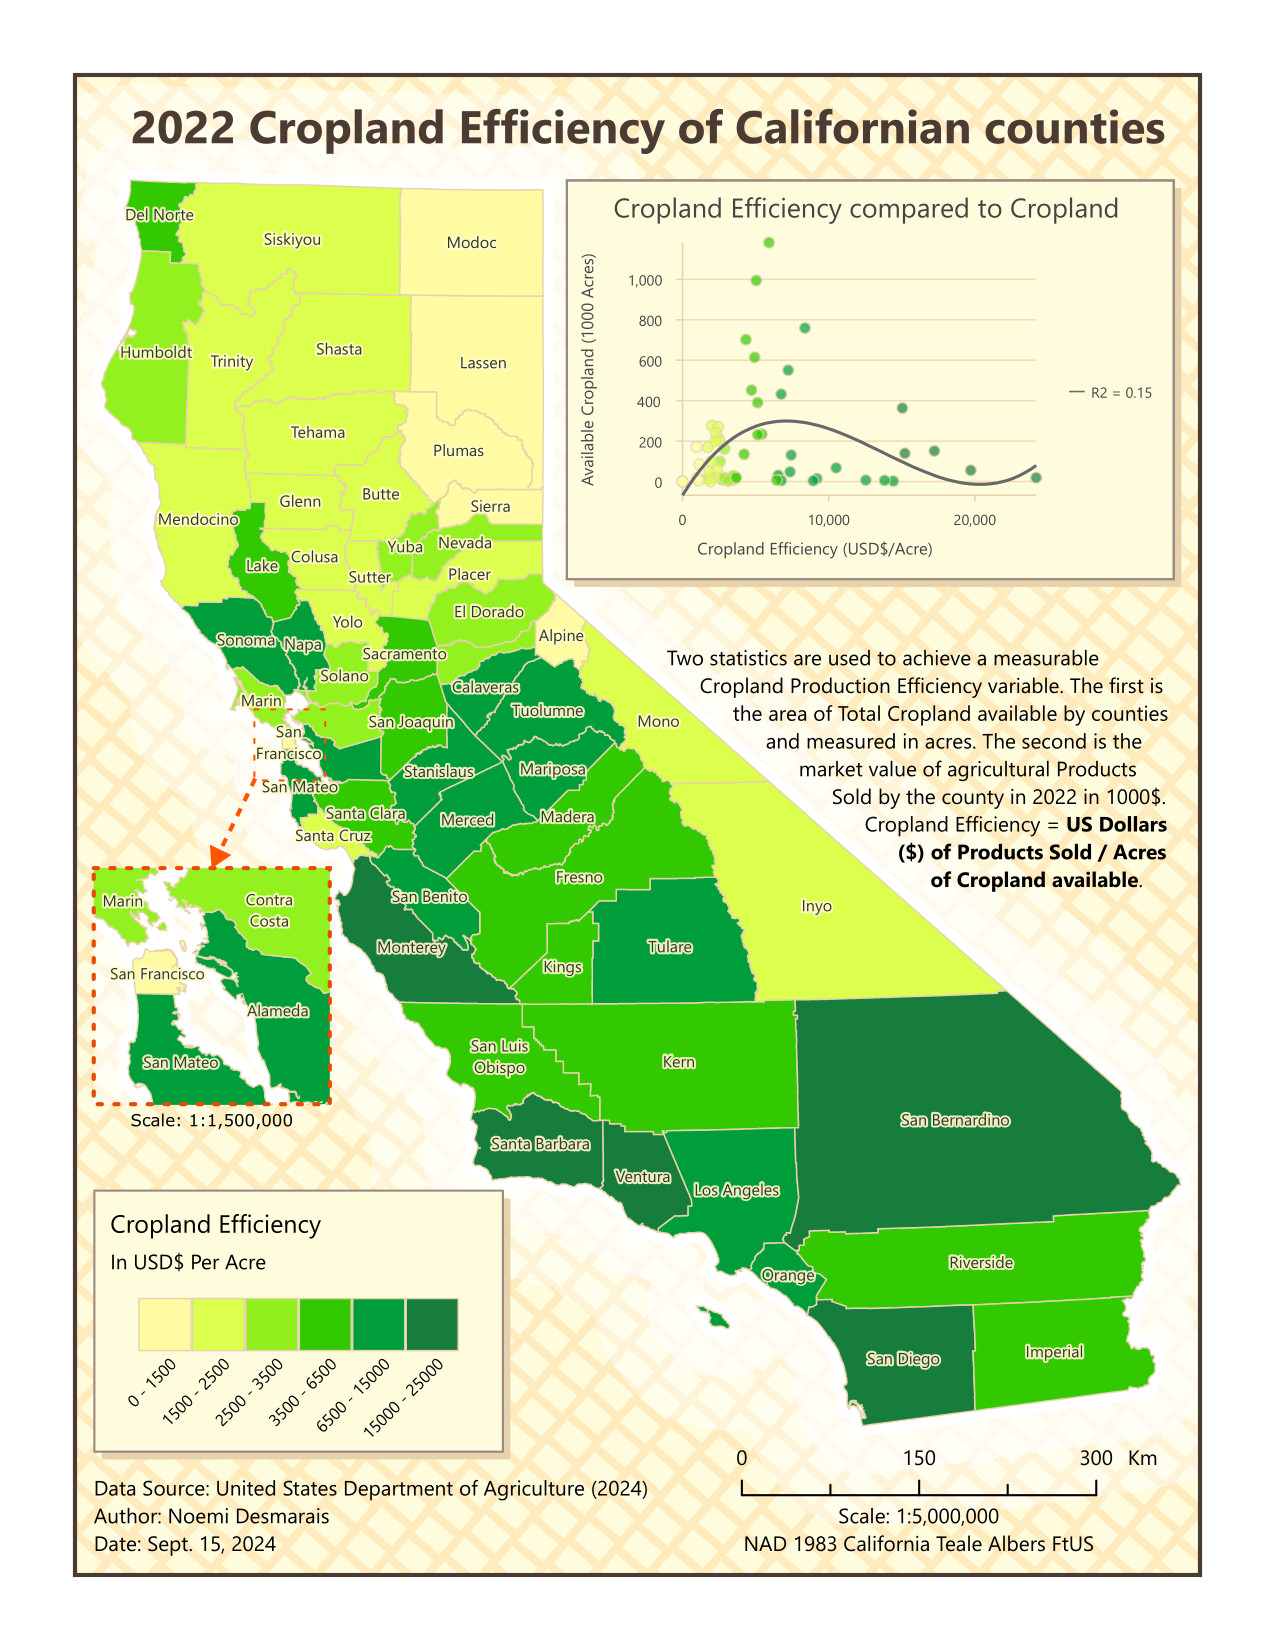
My first example of Data Visualization presents the spatial distribution and analysis of a single variable across Californian counties. It was prepared for the course GEOS457: Cartography and Geovisualization to showcase a thematic map layout for the US state of California. The selected topic is Cropland efficiency at the county level.
Two statistics are used to achieve a measurable Cropland Production Efficiency variable. The first is the area of Total Cropland available by counties and measured in acres. The second is the market value of agricultural Products Sold by the county in 2022 and reported in 1000$. With a simple ratio calculation, we achieve an Efficiency variable shown in US Dollars ($) of Products Sold / Acre of Cropland available.
- ArcGIS Pro Great cartographic capabilities
- Figma & Illustrator Putting together working templates will save significant cost in development later and make easier the client/specialist back and forth.
- Html/CSS Modern Web saves precious resources and contributes to a more optimized experience for all.
Other challenges overcome in the cartography class:
Tutorial 4: Proportional Charts
The Quest for excellent datasets
Data Capture
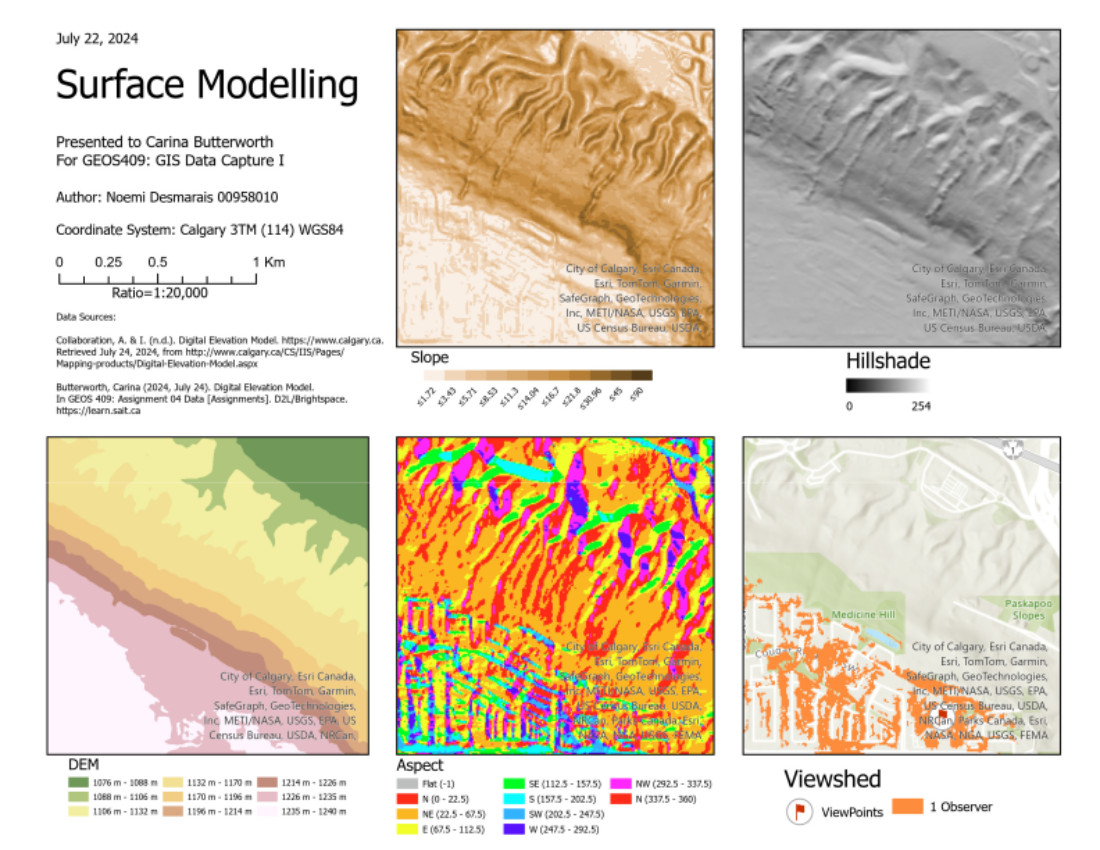
The BGIS program contains two Data Capture classes with one covering vector data sources and capture techniques such as digitization, georeferencing, mobile capture and the other covering aerial imagery digging into raster image theories and manipulation techniques.
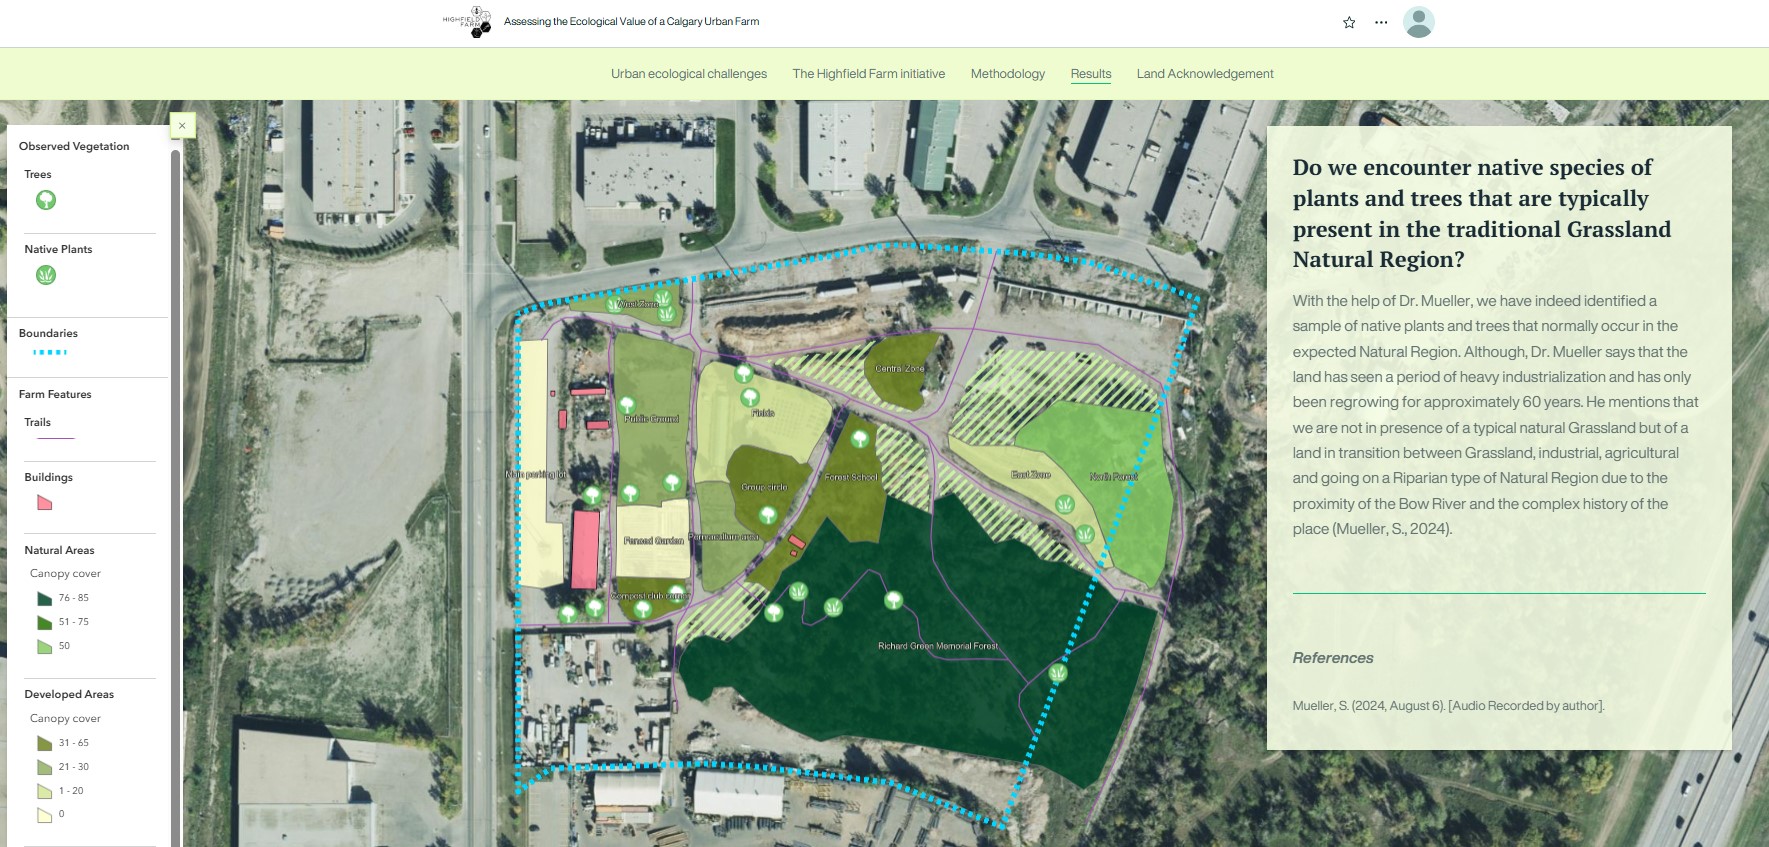
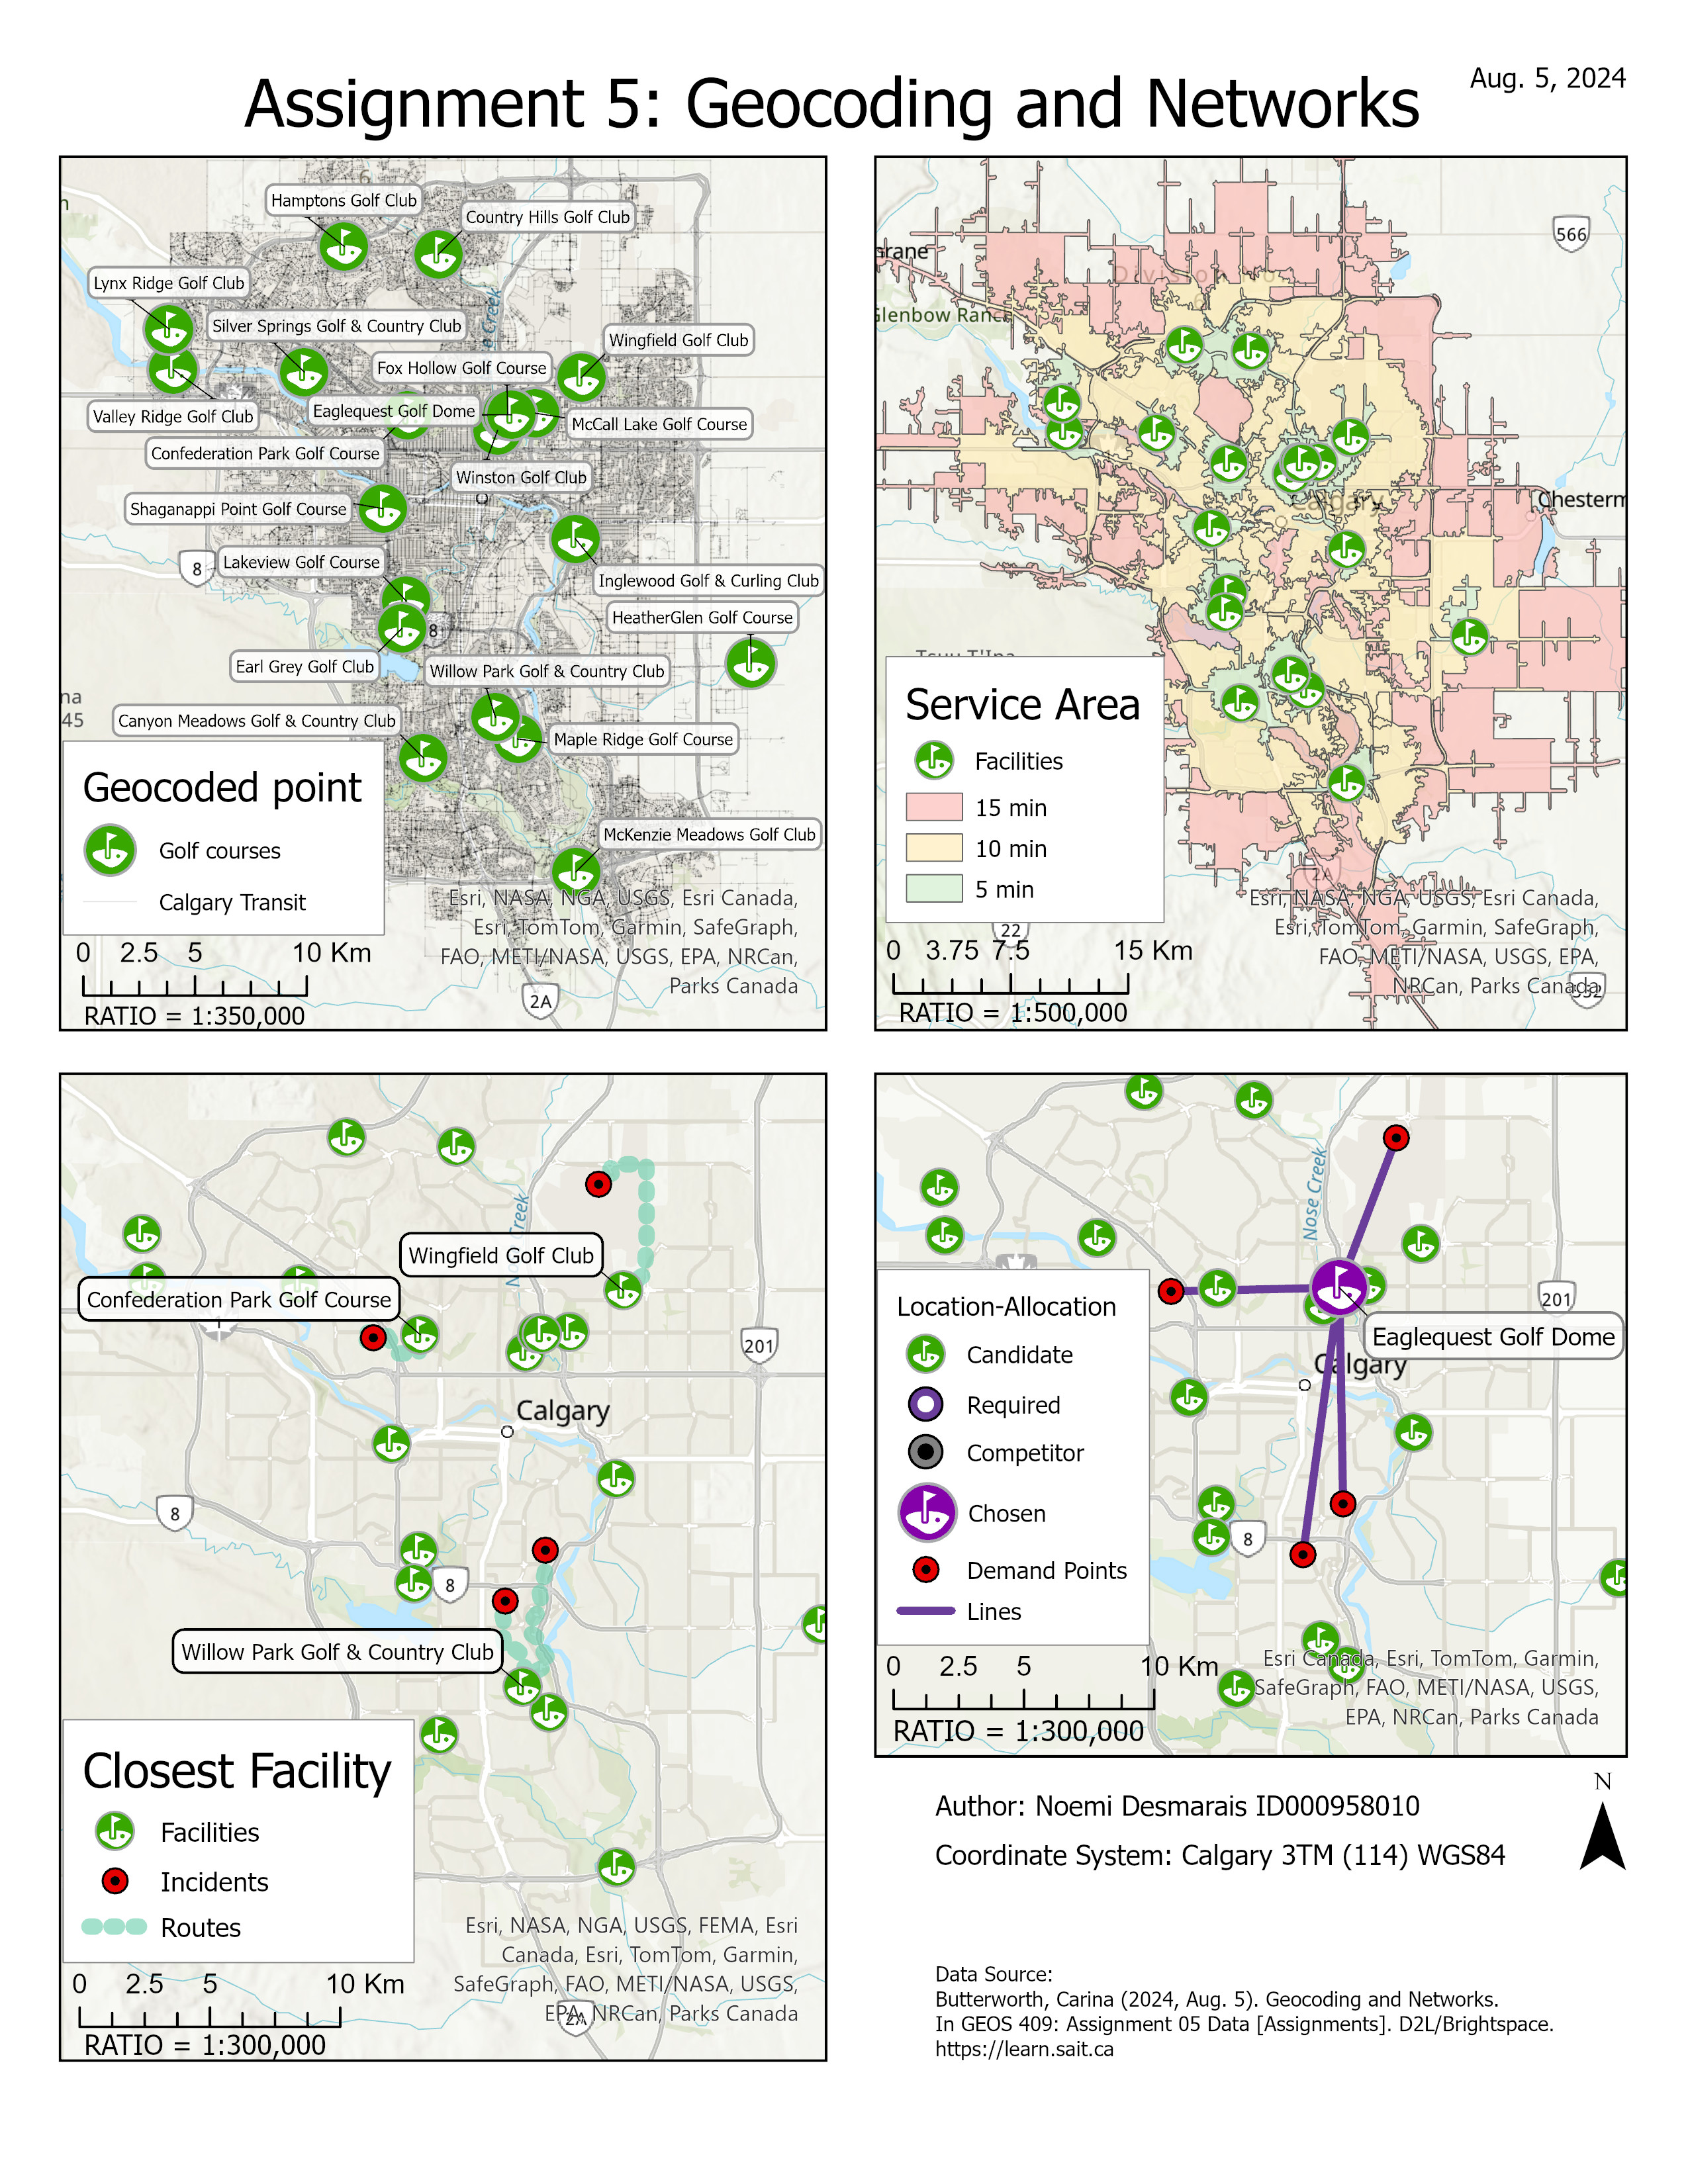
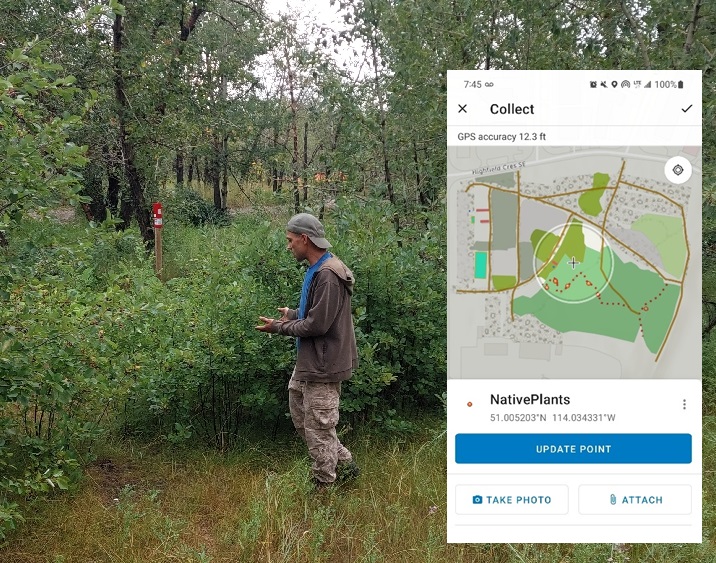
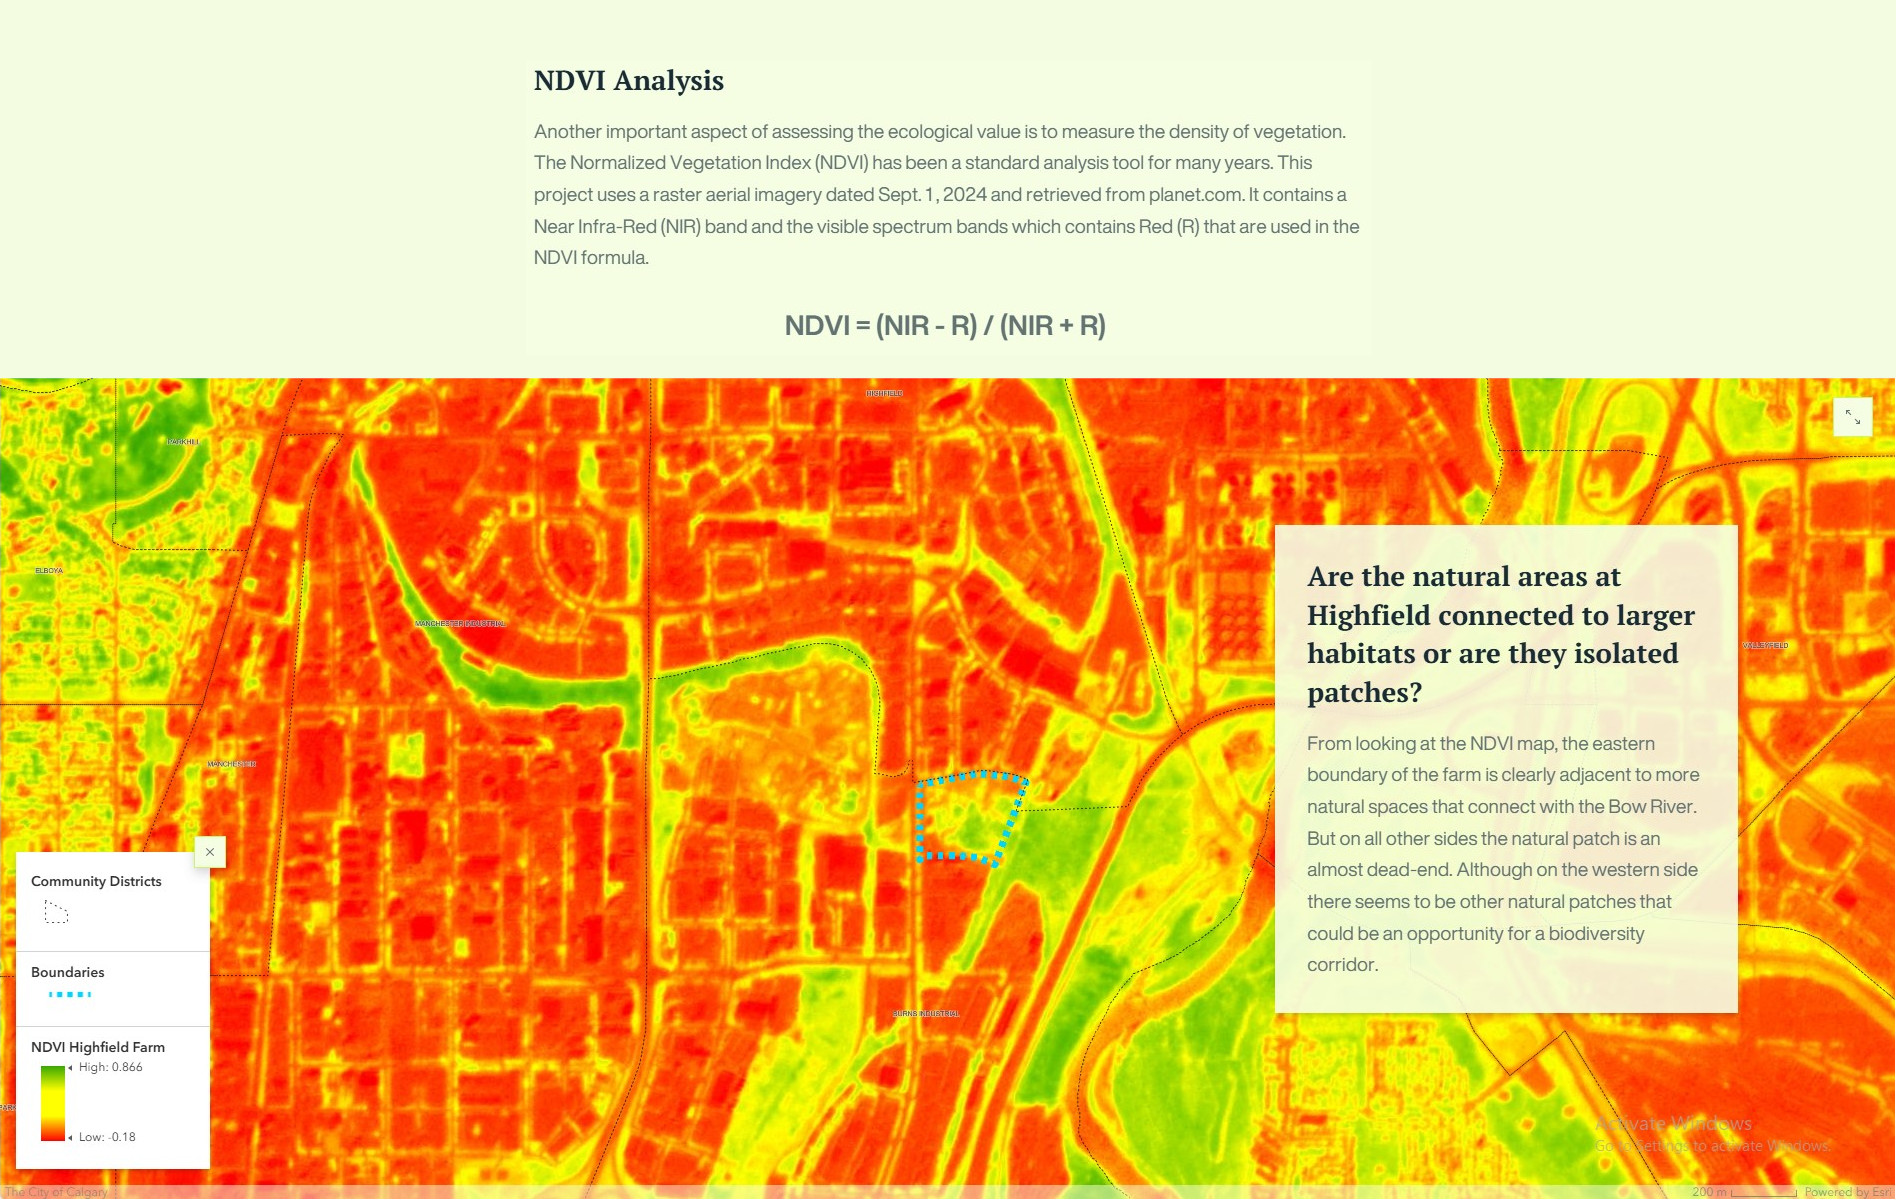
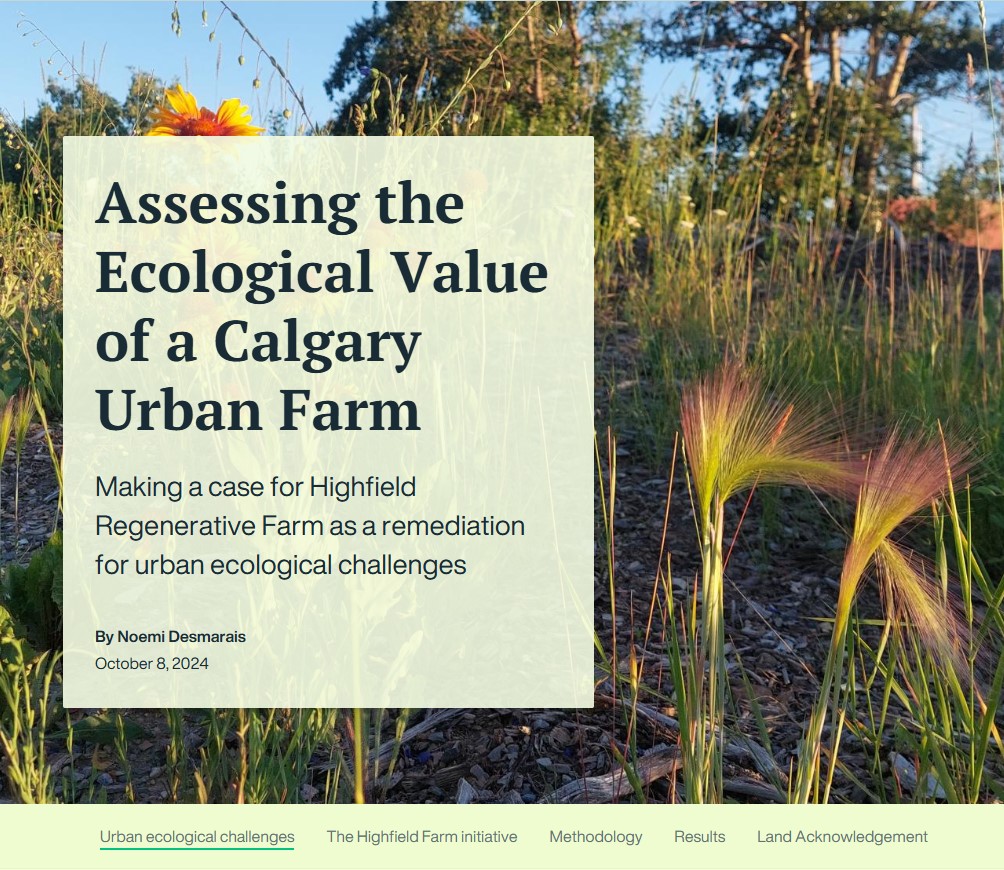
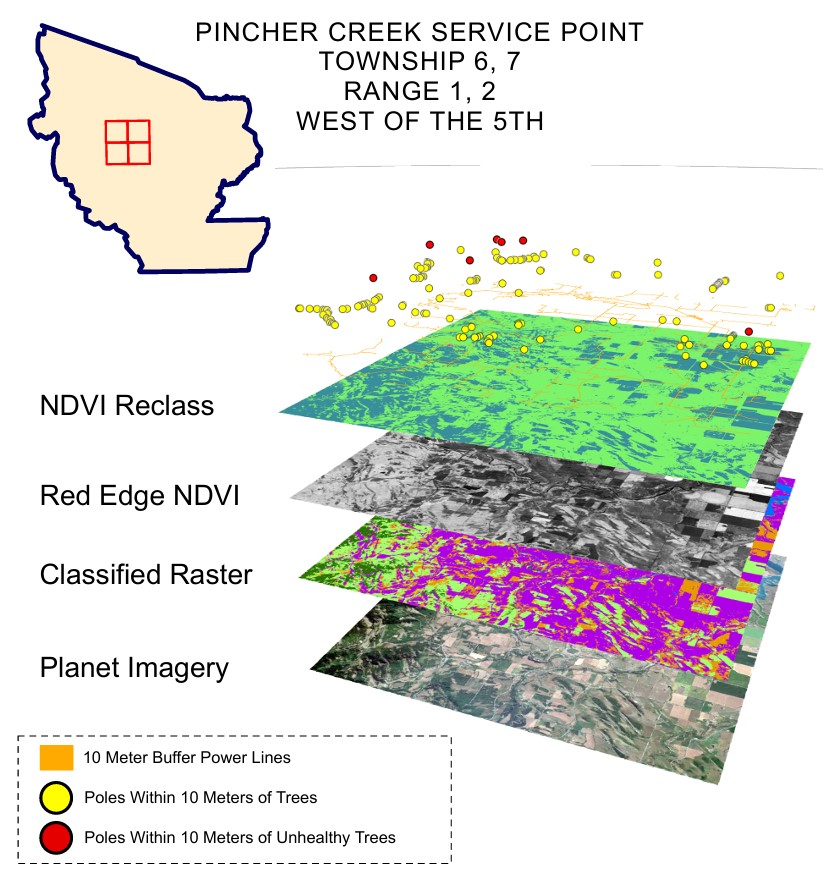
This Web GIS Assignment is a Web Map and Story Map adaptation of my Final Project presented to Carina Butterworth for the class GEOS 409: Data Capture I during the Spring 2024 semester. It focuses on mapping conservation efforts and potentials at Highfield Regenerative Farm to help solidify the ecological value of the urban agriculture project before city stakeholders.
- Aerial Imagery LandSat8, Planet, LiDAR
- Digitization and mobile collection FieldMap, QuickCapture, Survey123
Uniting data and results
Spatial Analysis
Geospatial Analysis topics were covered across most classes but the GIS Data Analysis course focused on statistics and correlation methods and Data Capture II course covered raster image analysis.
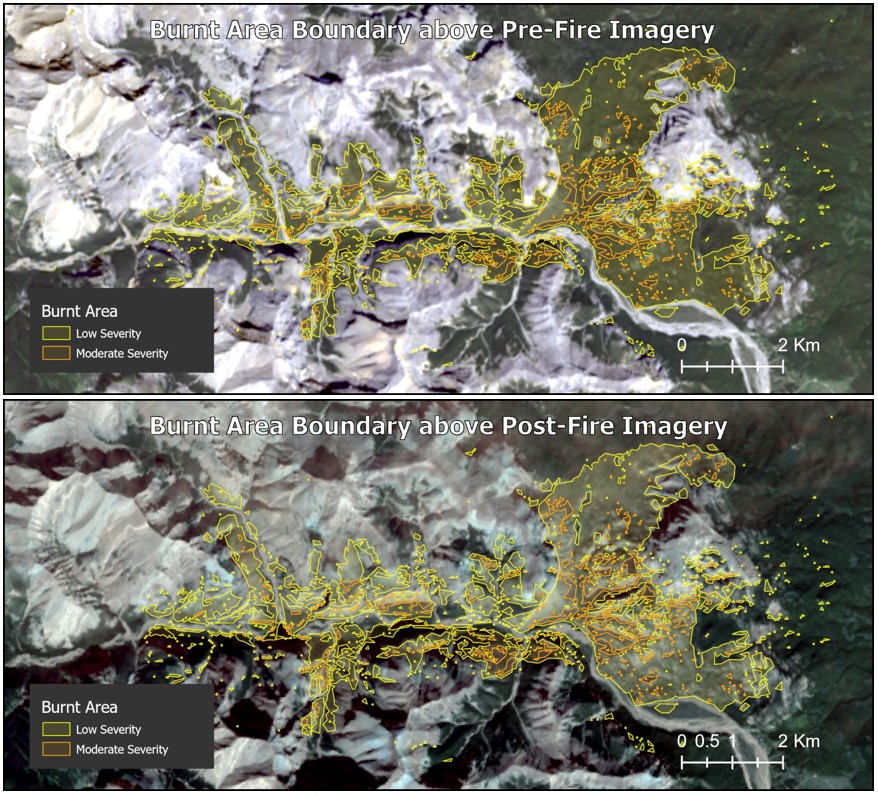
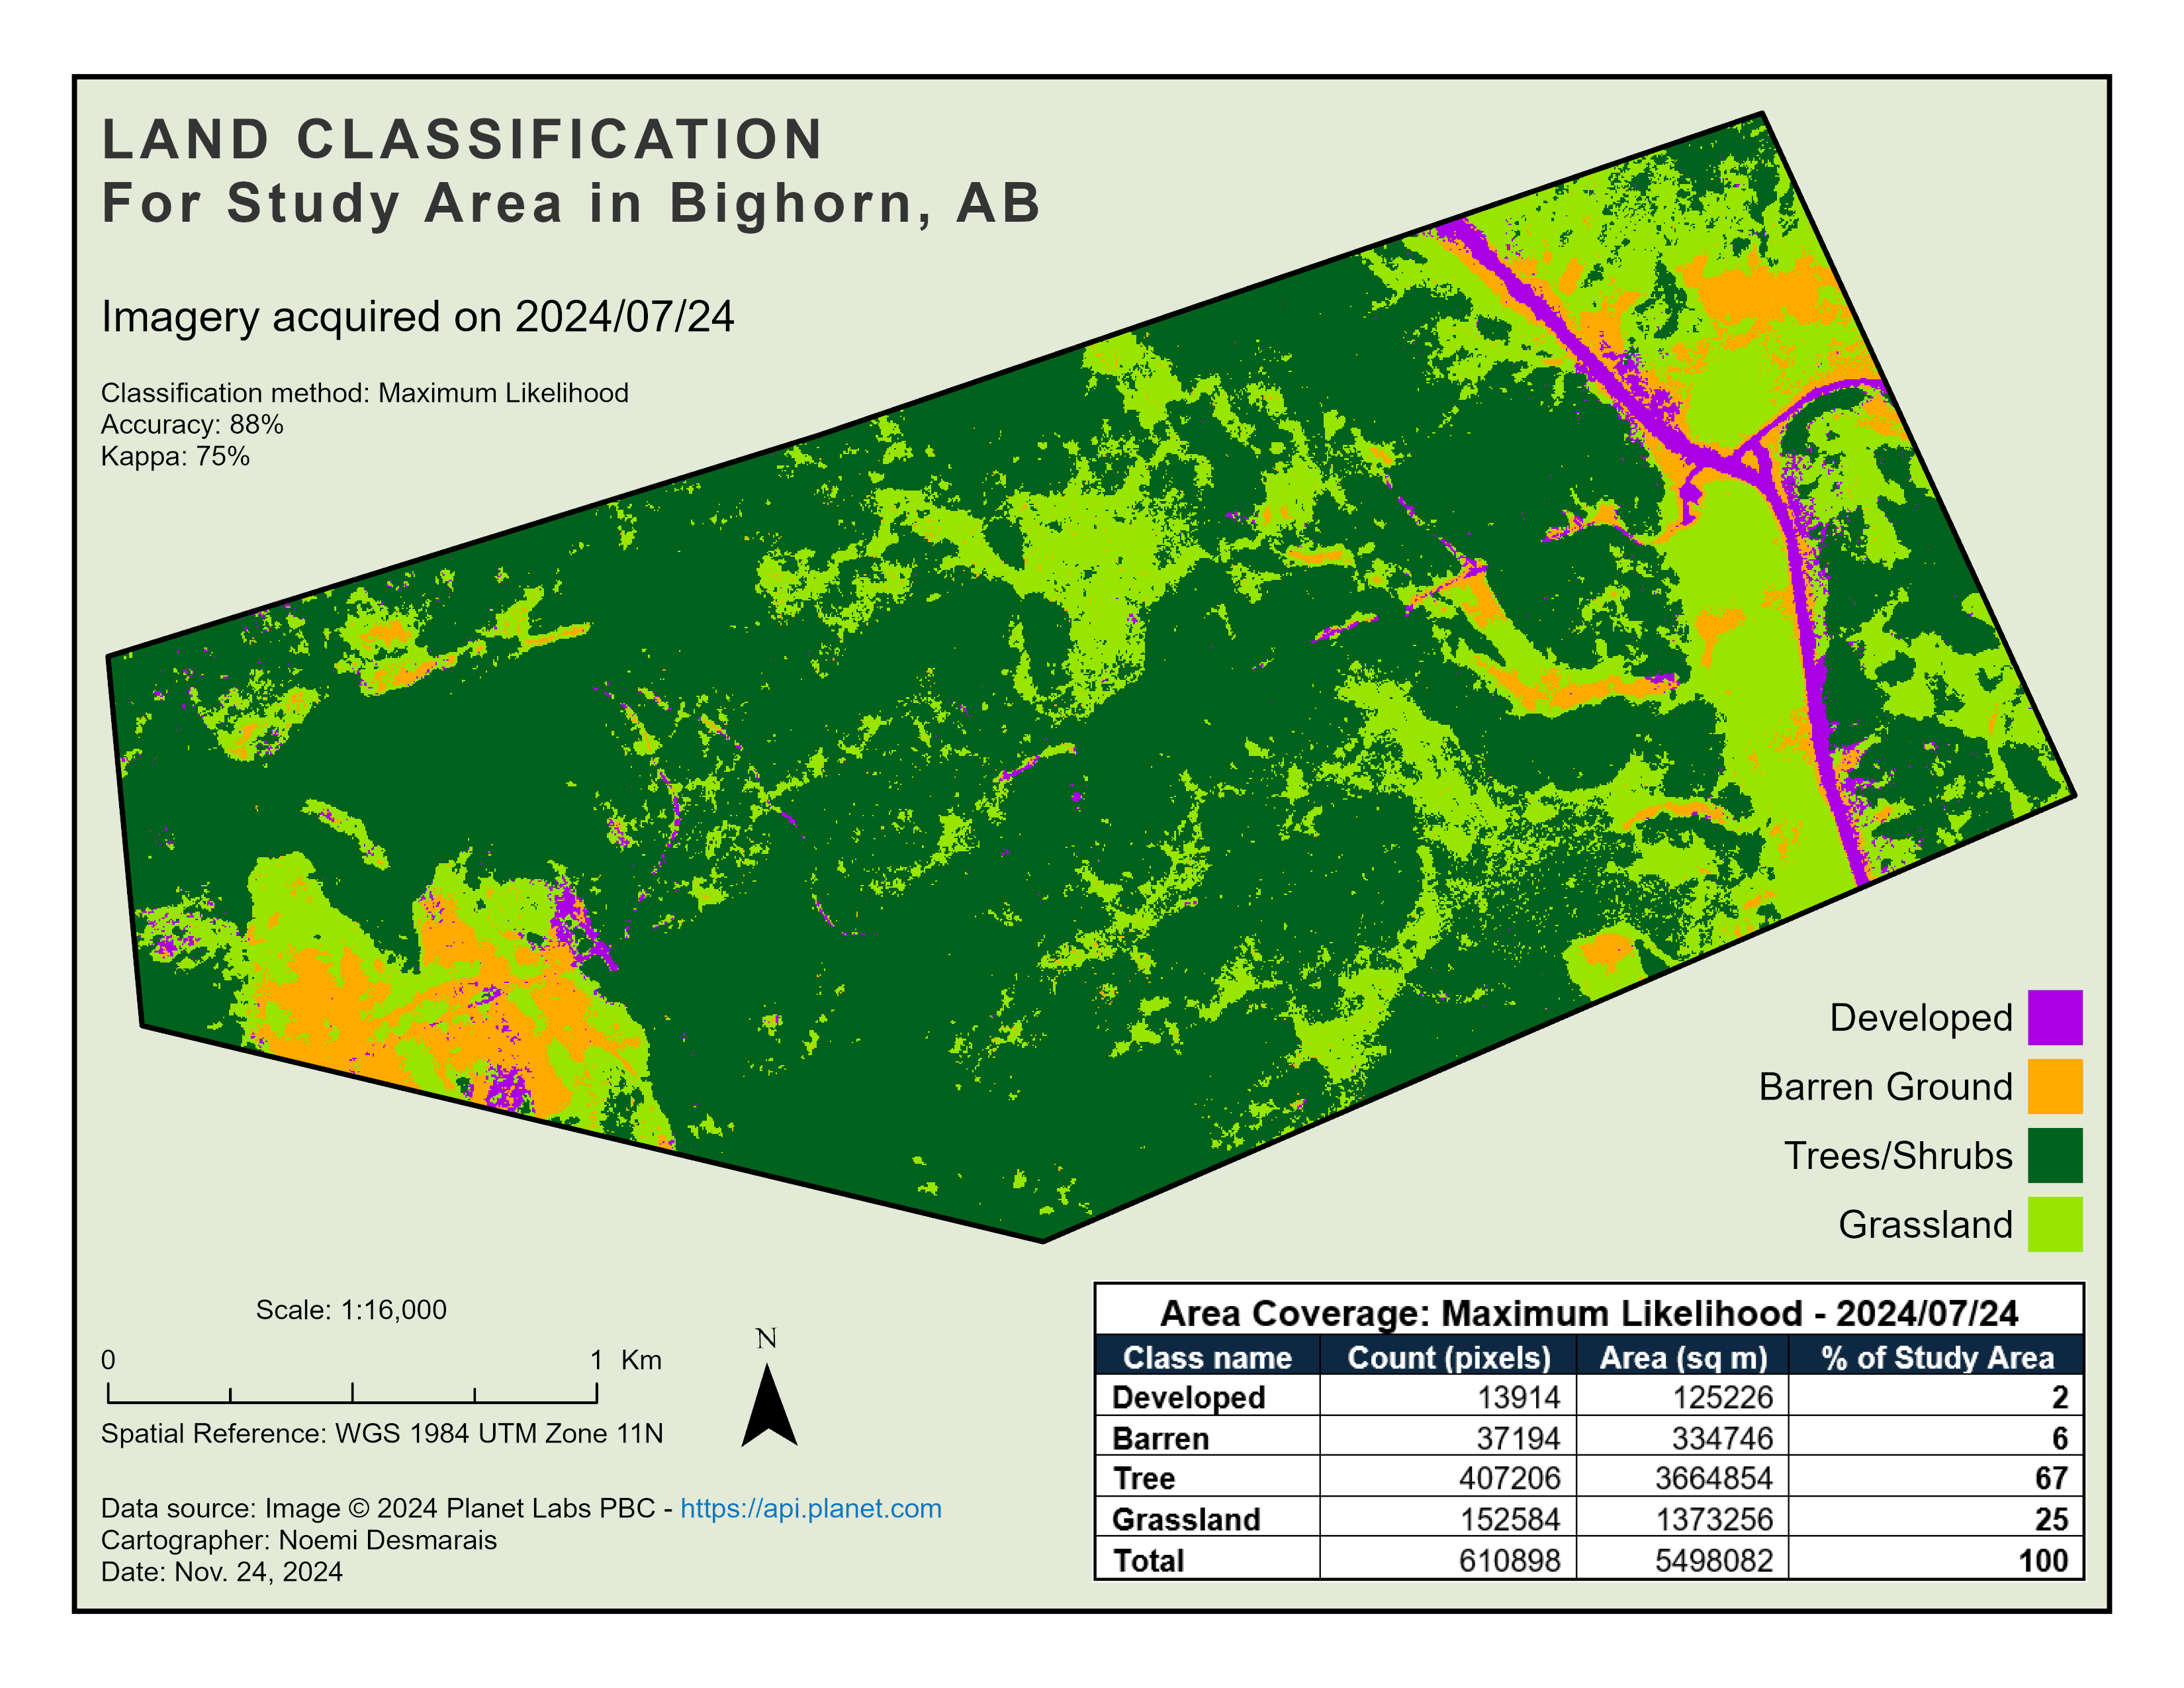
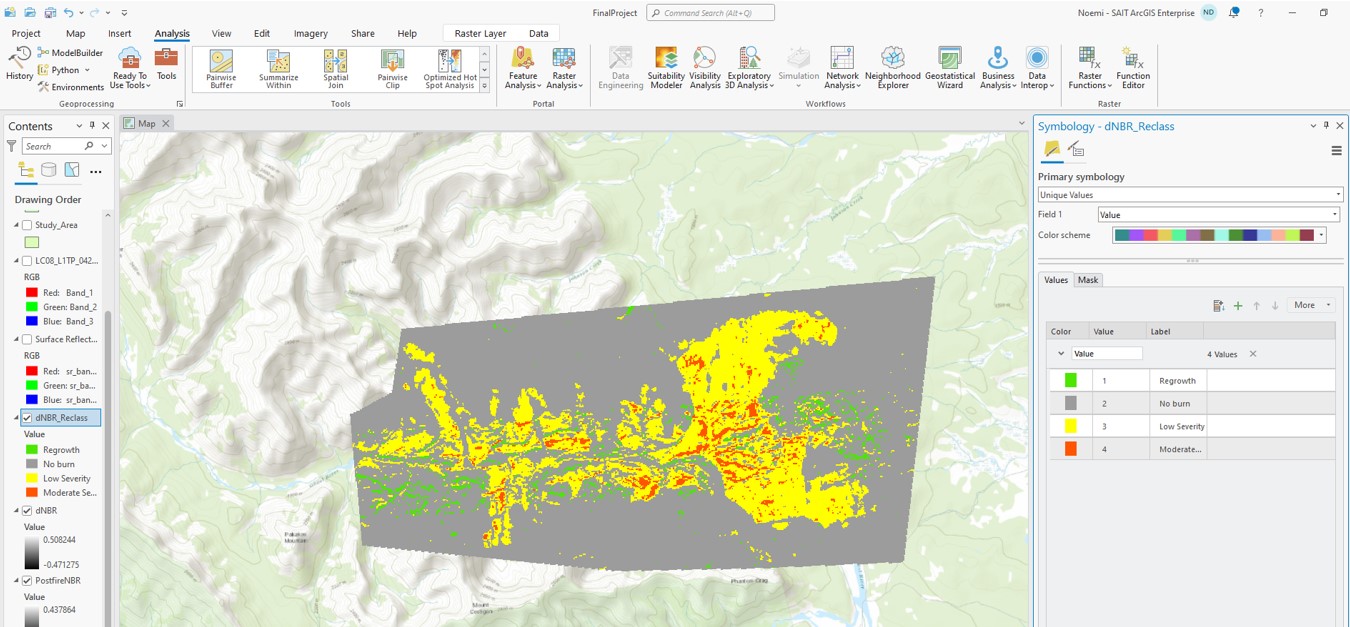
This is the final project for GIS Data Capture II and it presents the results of a Difference Normalized Burn Ratio (dNBR) analysis of the Blackrock Mountain 2020 wildfire.
The dNBR calculation helps determine where and how severe a wildfire event occurred by relying on the spectral difference between NIR and SWIR in burnt areas compared to the state of vegetation prior to the wildfire.
- Image Analysis Indices, NDVI, dNBR, Neighbouring functions, Reclassification, Optimal routes and more
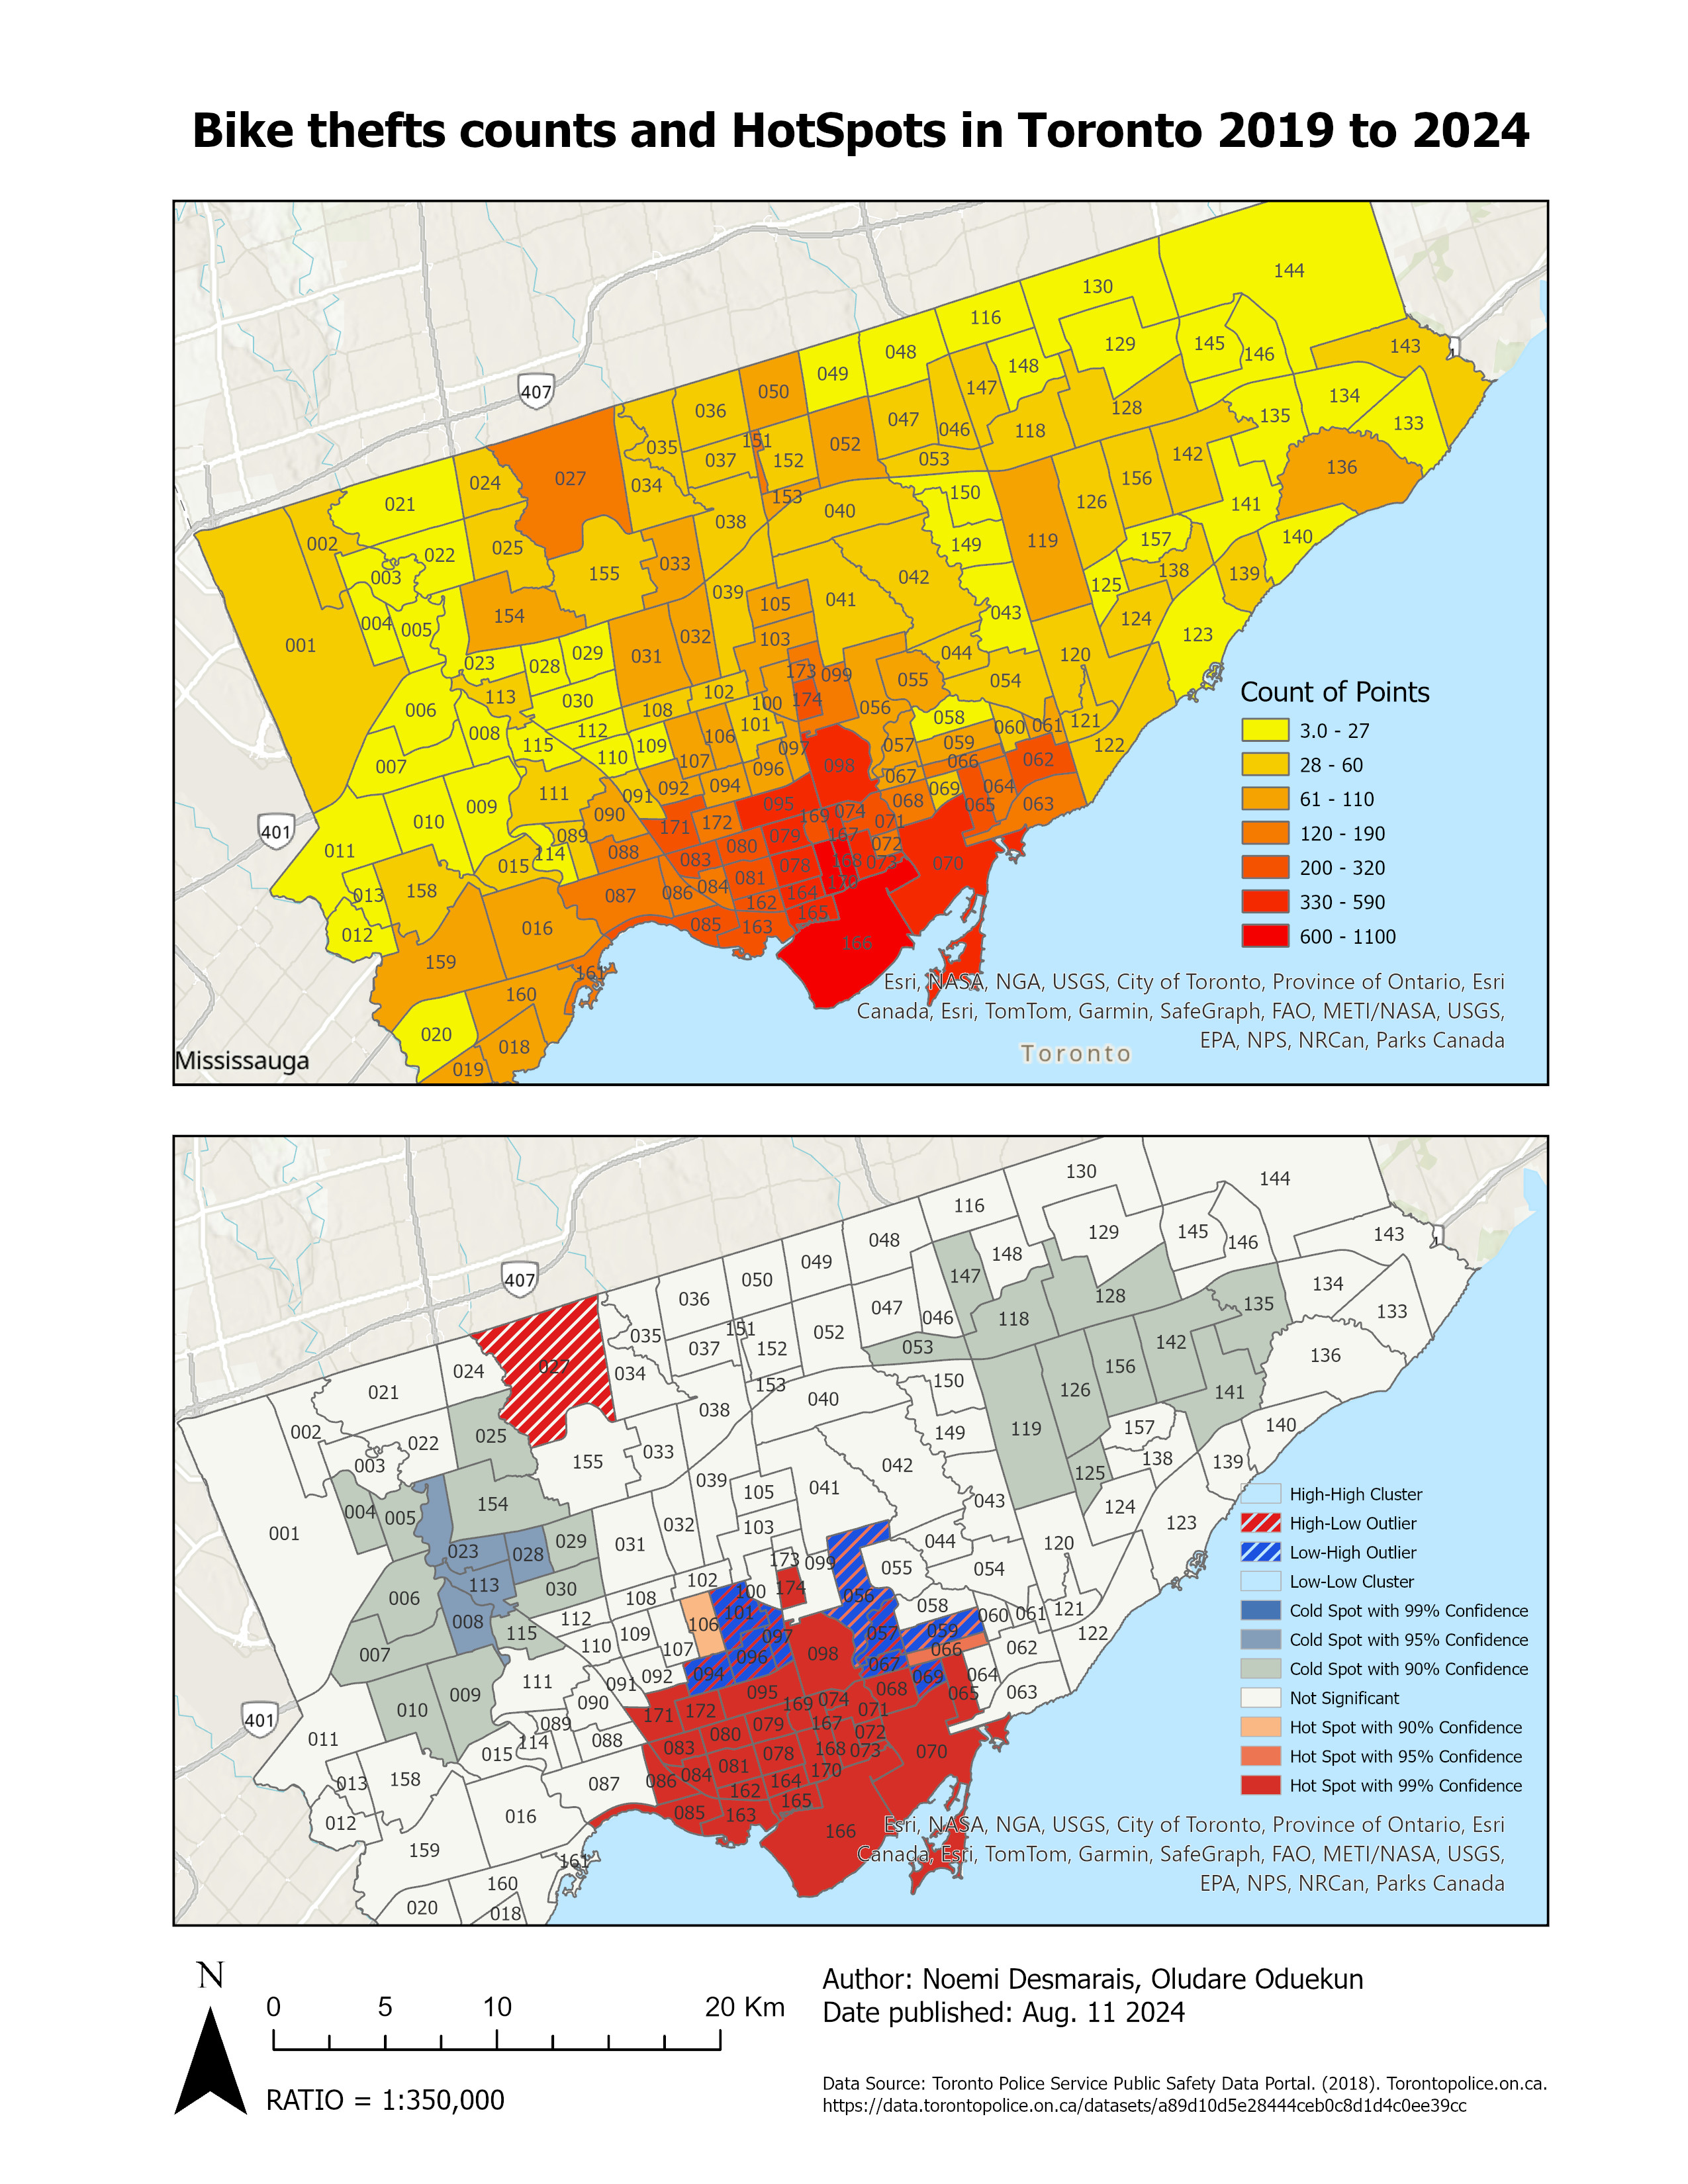
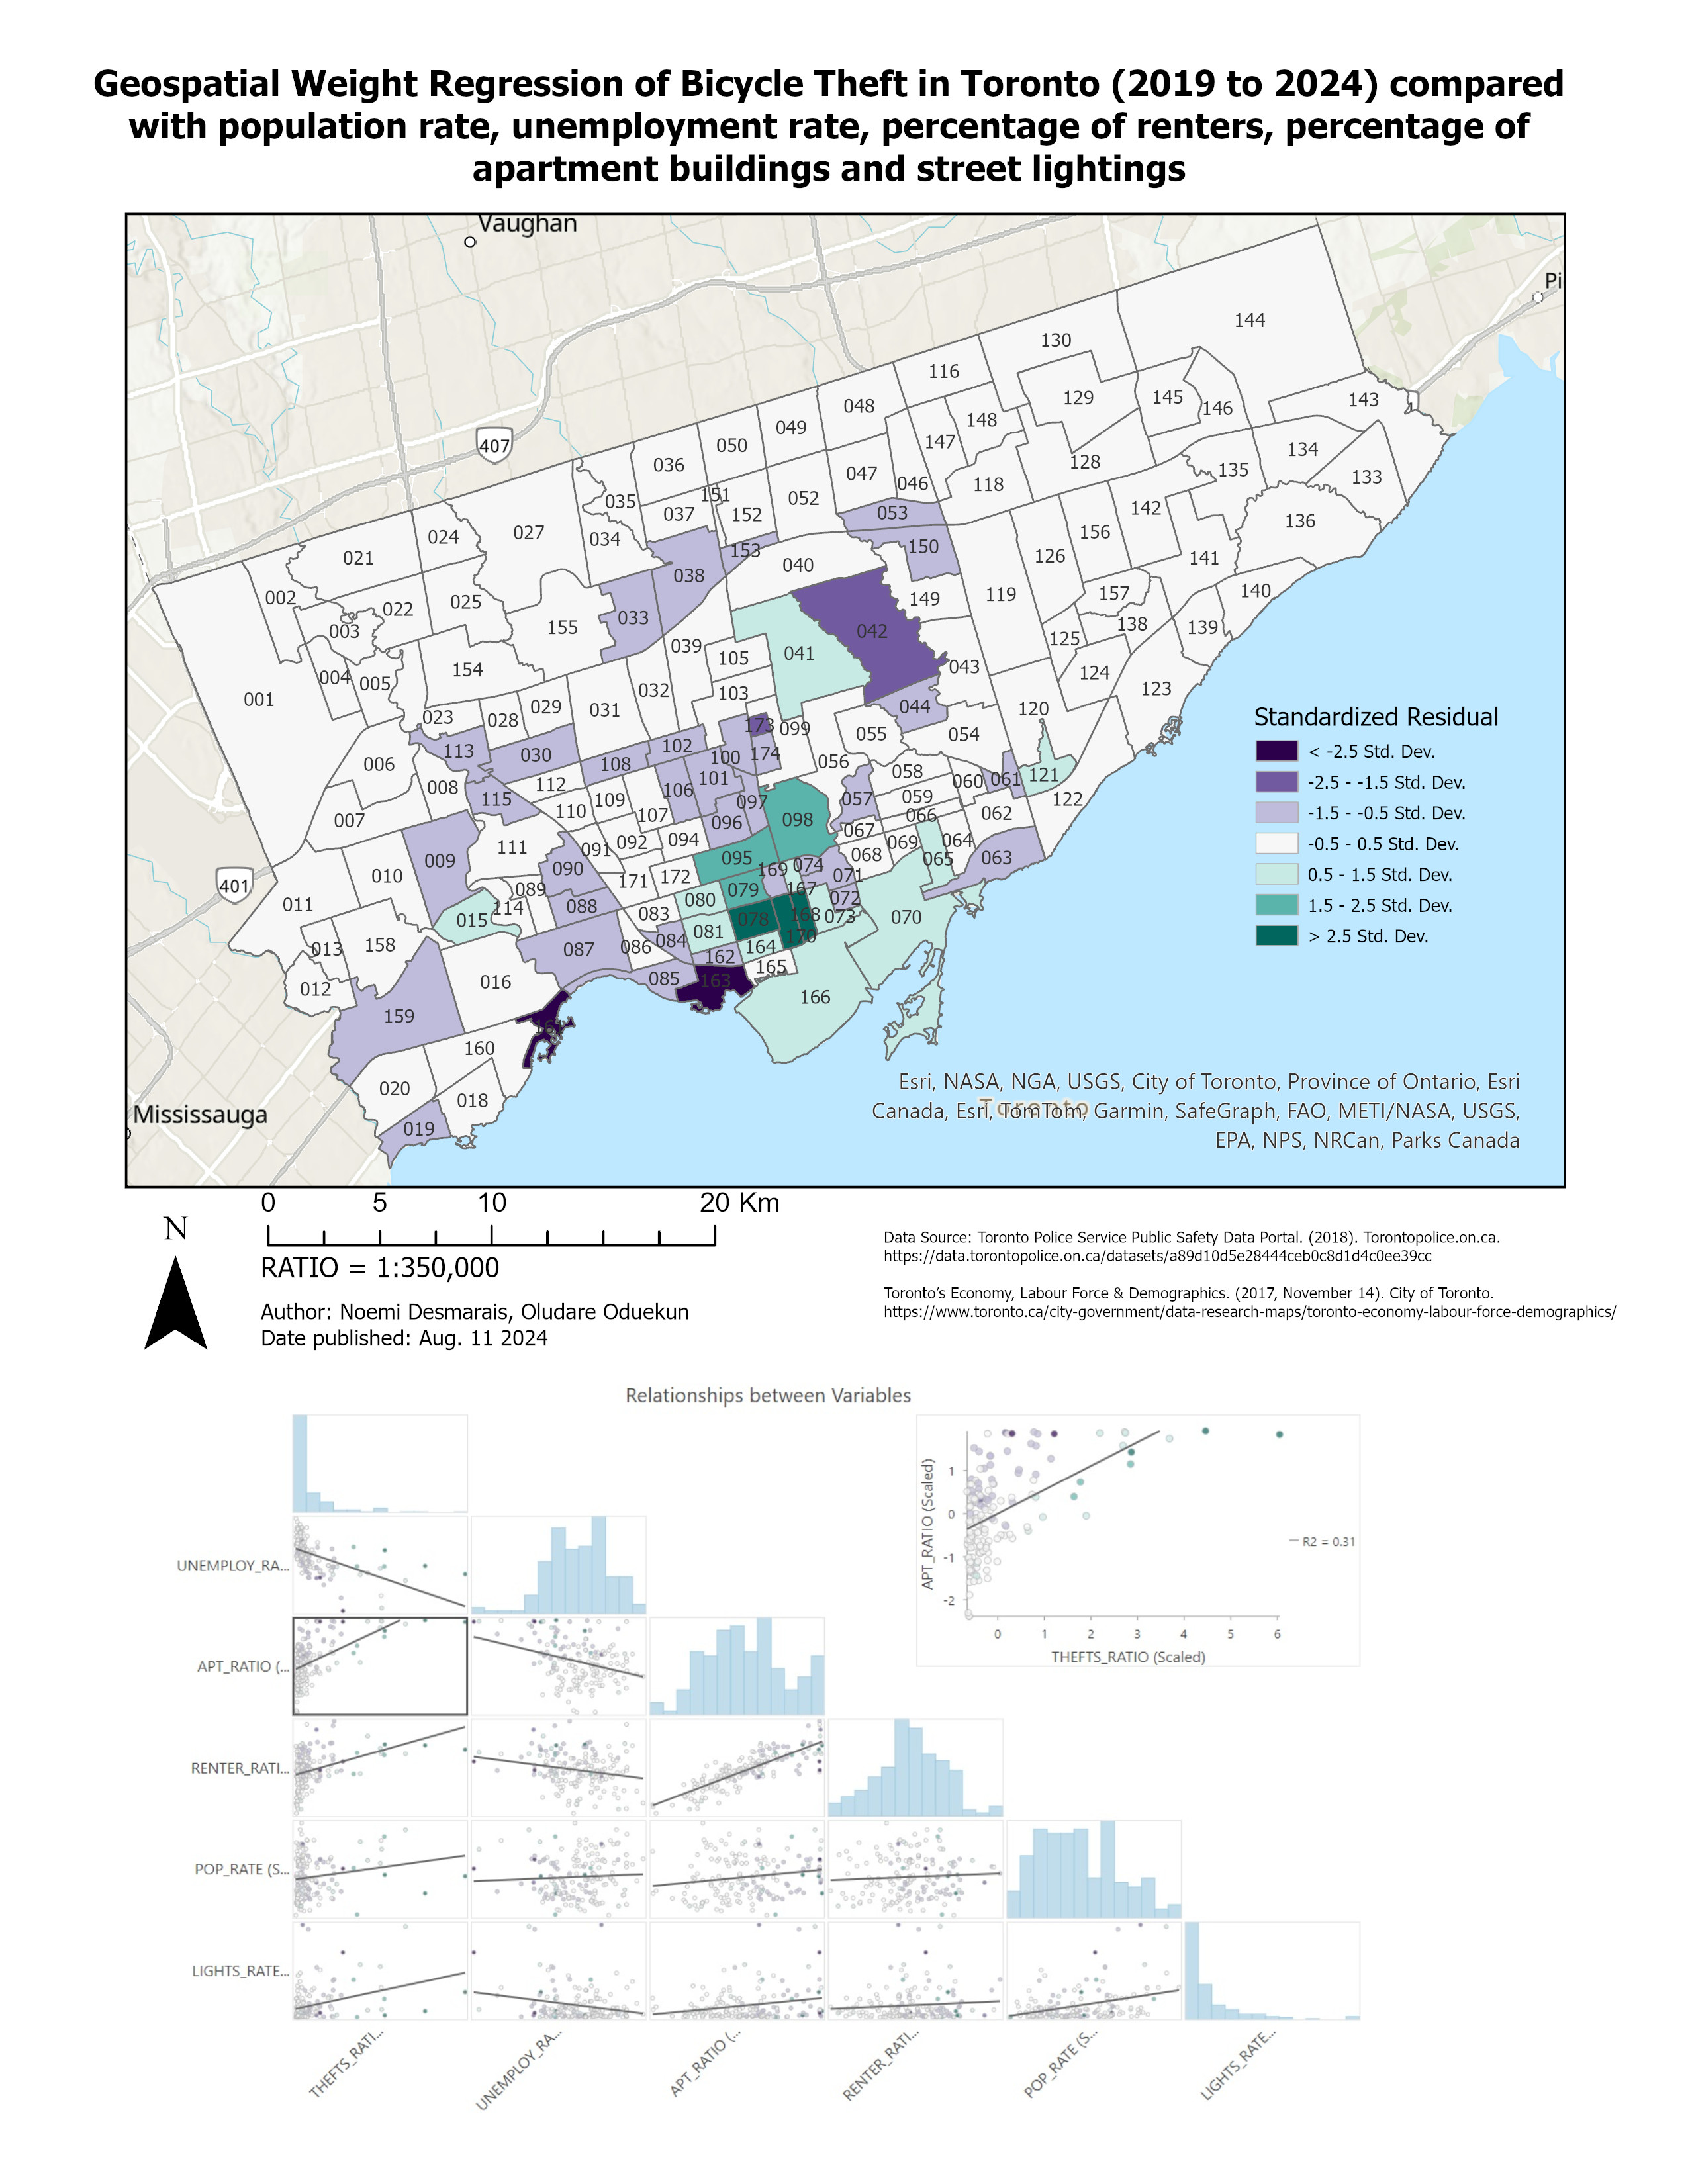
- Data Analysis Hotspot Analysis, Regression Analysis(R2), Clusters & Outliers
Closer to the user
Development
A good addition to a digital strategy, mobile applications and web development allow businesses to stay in the reach of their users at all time.
Mobile development is an exciting market with so much opportunities.
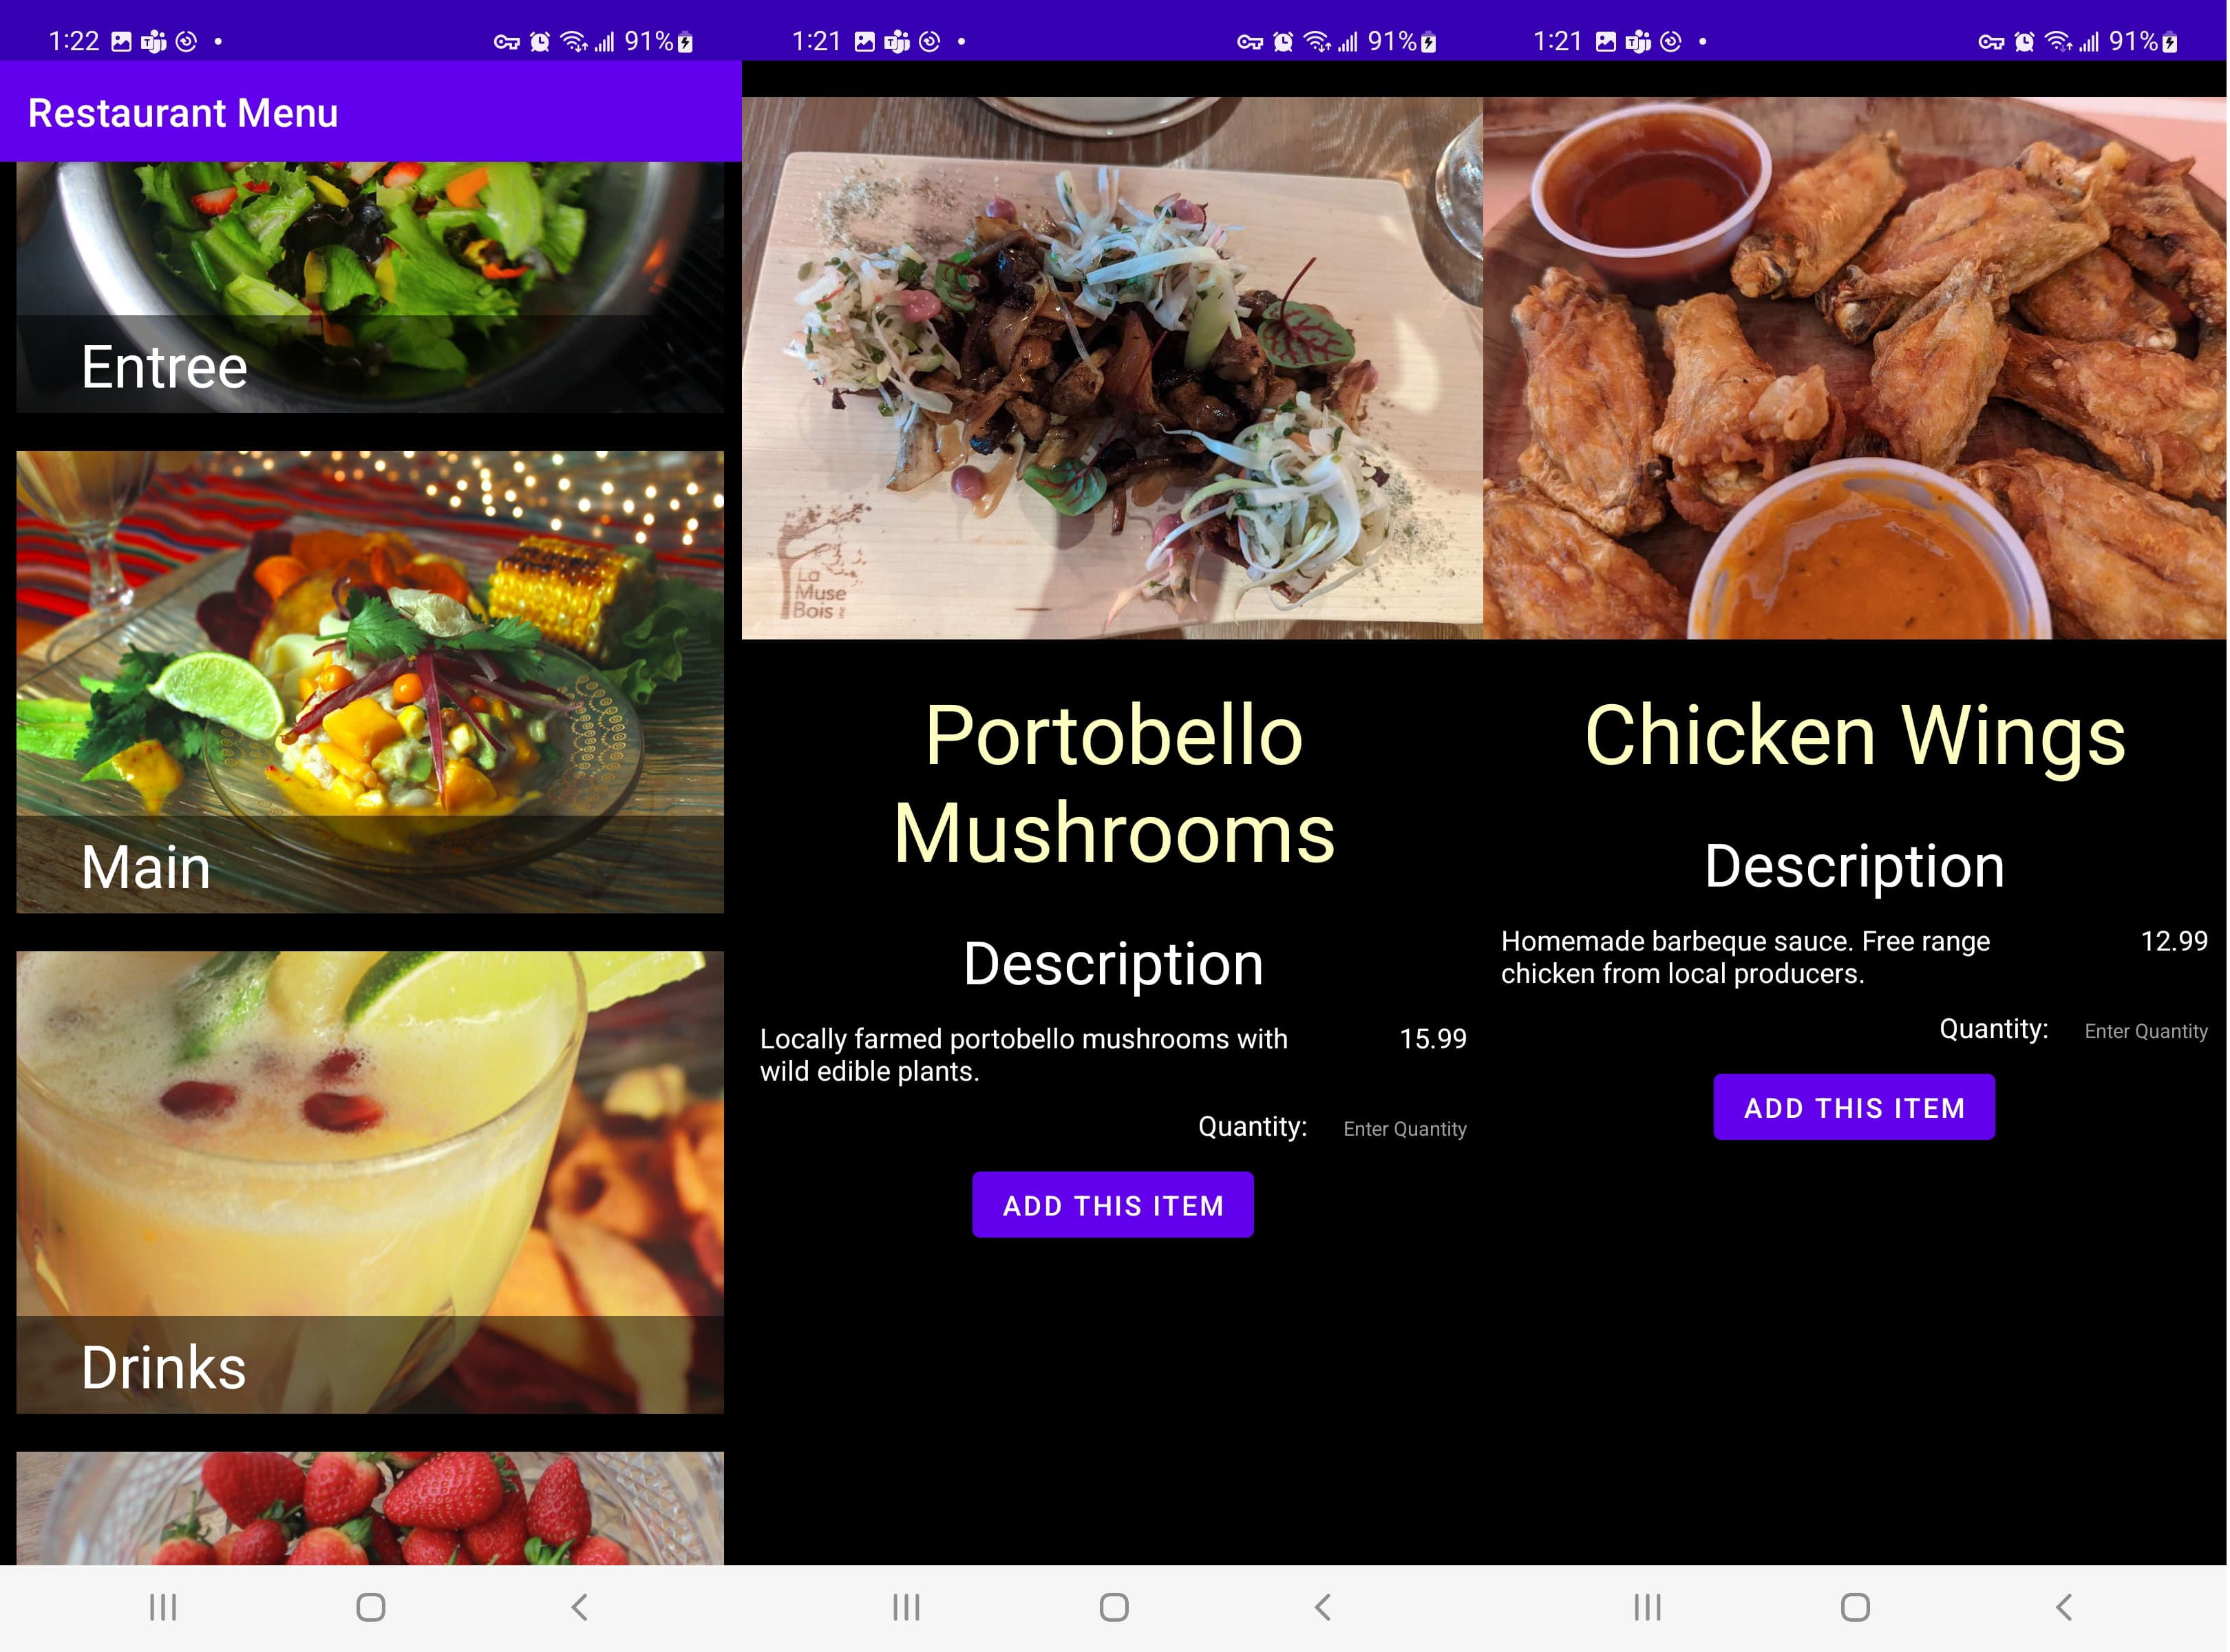
- Android apps Android phones are 70% of the global market. My first mobile apps were built with Java for Android SDK. But with React Native I can also do cross-platform web applications.
- React/Next.js This portfolio is built on Next.js in Typescript which is a framework based on React. Modern Web offers great flexibility and eases up development while speeding up content display.
- Node.js Has become the favorite standard to support content-driven website and applications. It allows to run JavaScript on servers and possibilites are wide and wild.
- Microservices/REST API To share data accross different domains, pages, applications and more
- Java/Spring Still a robust solutions for complex applications such as back offices and more
Telling stories
Marketing
I have many years of experience in online marketing, from content writing to website optimizations all the way to digital campaigns creation. I worked both in communication teams for organizations and as freelance consultant for various clients such as real estate agents, university lecturers and more.

Nowadays, an integrated marketing strategies include digital products. There is no one fit solution model and context and content matters above all.
- Content writing Technical writing, Reports, Marketing emails, Social Media Posts, Blog writing, Website content.
- SEO & Geotargeting Search engines are the most useful tools to reach an audience with a need but competition is fierce. Having a well optimized and referenced Website coupled with a local strategy will go a long way to increase organic referencing.
- Photography A picture is worth a thousand words and I have a history of creating visual campaigns with original photos. I snapped all the photos used for the projects displayed on this portfolio.